We recently released mule 3.1 Community and Enterprise editions. In this post, I'd like to introduce Mule 3.1 Enterprise, the first Enterprise release of Mule 3.
Mule 3.1 Enterprise builds on all the great new features in Mule 3 and Mule 3.1 Community, adding a host of enterprise capabilities, including the Mule ESB Management Console (MMC), premium connectors, retry policies for self-healing connections, and out-of-the-box high availability (HA) and failover.
We introduced MMC early last year with the intention of doing something a bit different than other “management consoles” out there – we wanted to build something that was valuable not just for IT operations, but for developers as well. So for developers, we included features like service flow debugging, performance diagnostics and tuning, among others. For operations staff, we included things like monitoring, intelligent alerting, fine-grained ESB control, etc.
In this release, we took things even further, augmenting MMC with new capabilities inspired by the DevOps movement, including collaborative deployment, fine-grained access controls, and customizable dashboards. These features allow cross-functional IT teams to leverage the same web-based console to deploy, monitor and manage Mule applications, enabling more agile deployment processes and reducing the risk of change.
Let me give you a quick tour around some of the new capabilities that MMC offers:
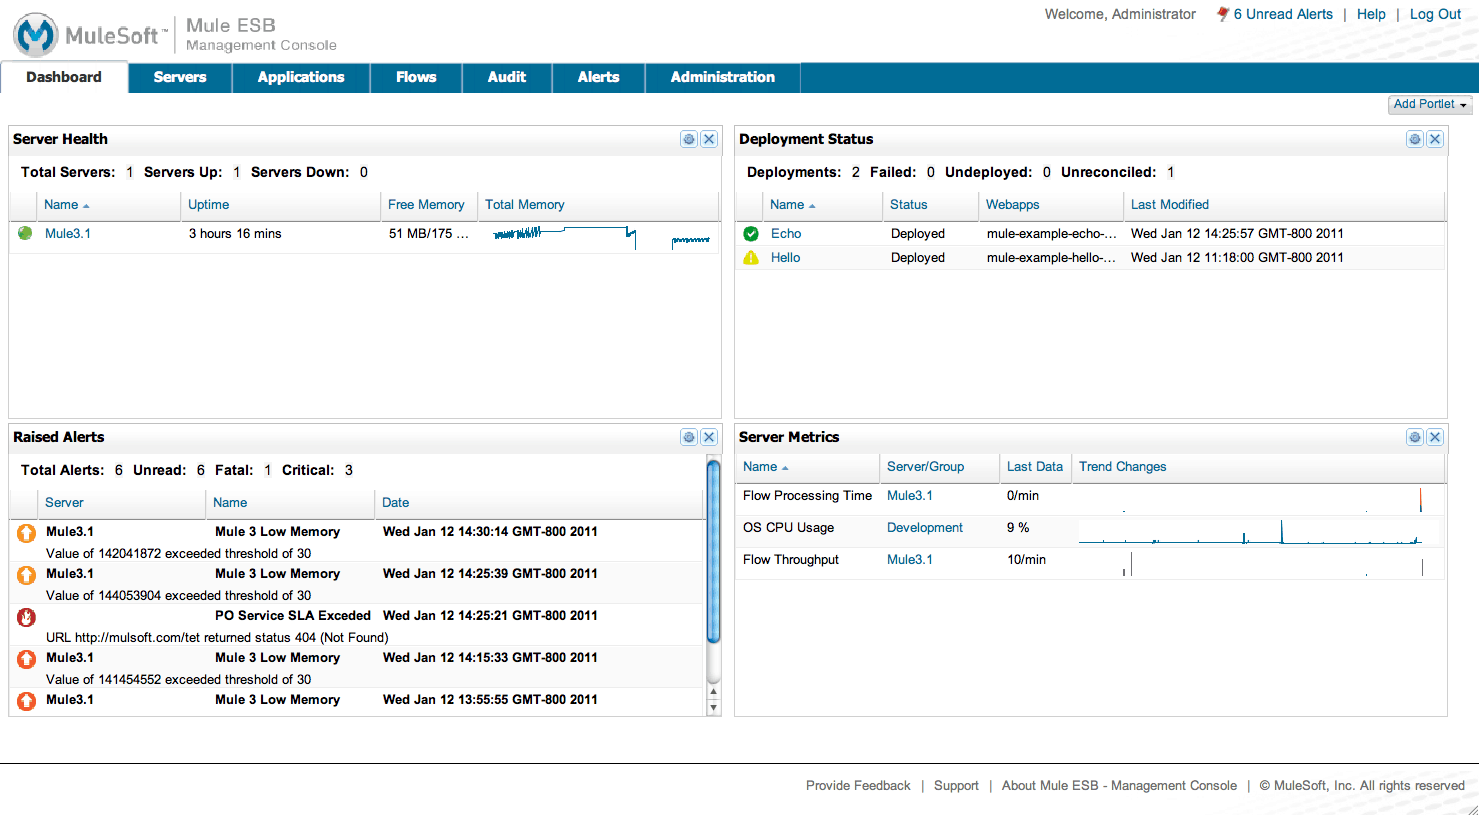
New customizable dashboards let you monitor your entire system from a single customized screen. In addition, you can create your own metrics using a JMX browser to select custom metrics.
With MMC's collaborative deployment features, you can store Mule applications (including multiple versions) in a central repository and remotely provision them to one or multiple Mule servers with just a few clicks.
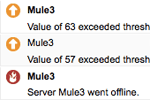
MMC's alerting capabilities allow you to define service level agreement (SLA) alerts on resource utilization. In this release, we added the ability to create custom alerts by using JMX metrics. Yo can also escalate alerts via email or SNMP or trigger corrective actions using custom alert scripts.
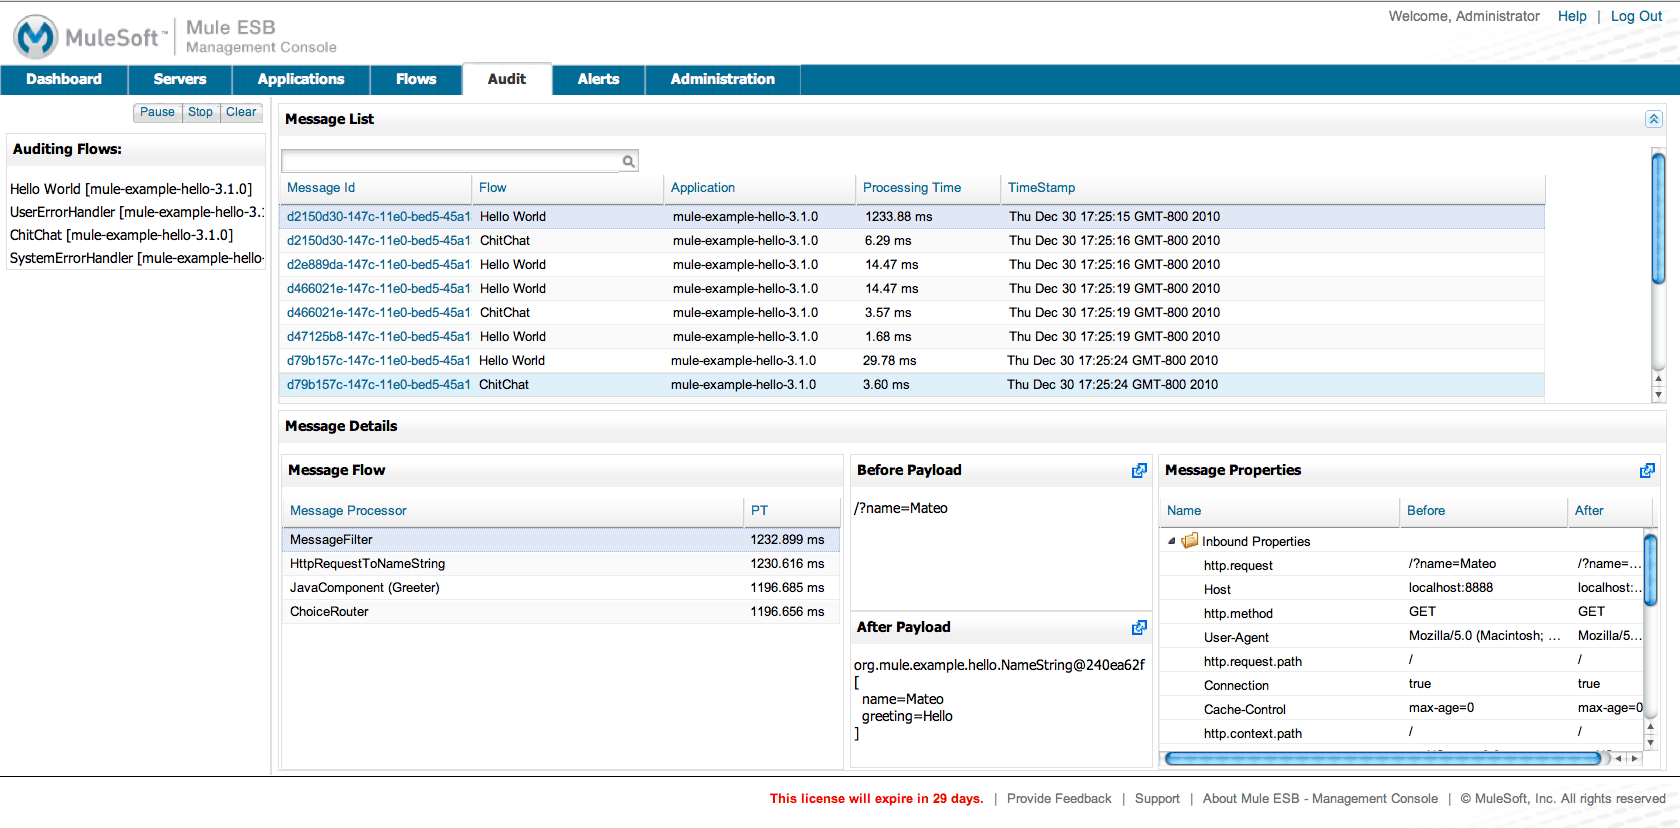
With service flow debugging, you can audit in-flight messages flowing through the bus. In this way, you can get deep visibility into actual message flows and quickly pinpoint and resolve Mule ESB configuration issues.
I've just outlined a few of the new features in MMC, but there is much more. Read more about Mule 3.1 Enterprise with MMC, or download it now. In this release we made it really easy to install, by simply downloading, unzipping and running the file – try it for yourself!