The promise of a monitoring solution that will pinpoint application problems and give you exact steps to fix the problem has remained a dream. In addition, monitoring systems have become notorious for being expensive and difficult to maintain. Diagnosing application performance problems requires application-specific diagnostic information that general-purpose monitoring tools often do not provide.
While system monitoring products are useful in triaging a problem and assigning responsibility to a particular team (for ex: Application Server team), they often do not provide the necessary details to help you determine the problem and fix it. Monitoring products are described by their users as mile wide, inch deep – great for providing high-level visibility into broader systems such as browsers, web servers, app servers, network devices, databases, storage etc, but not so great for specific diagnostic information that you need for fixing problems.
Instead, it often takes specific diagnostics tools tied to the application container to really be able to effectively drill down into the data sufficiently.
In this article, we will use Apache Tomcat as an example, and explore a few scenarios where Tomcat administrators need more information to help determine the problem.
Here is the setup:
An end-user complains that an application is not working. After looking at the health of various systems, it has been determined that your Tomcat instance is not responding. As a Tomcat administrator, you need to figure out why Tomcat is not responding.
Scenario1: Application Deployment issues
An ops person was asked to deploy a web application to a server where it is mapped to a specific URL such as http://www.example.com. The Ops person was rushed, and deployed the webapp but was not able to test it. It turns out that it was deployed to either the wrong Tomcat instance, or with wrong context path. Tomcat is running, but when a request comes in for http://www.example.com, Tomcat issues a 404 Not Found, which caused the user to complain.
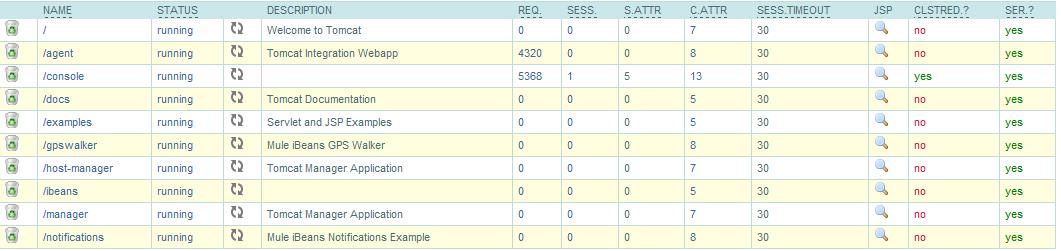
The first step you would want to do is check that the application is indeed deployed to the Tomcat instance and that it is currently running. This might be time-consuming if you needed to check this on multiple Tomcat servers, as typically you need look for the application in the webapps directory locally on each instance. However, for efficient diagnostics, you might want to be able to check the presence of an application and its running status on multiple Tomcat instances from a central console. Below is an example screen shot that shows list of applications and their running status:
Scenario 2: Out of Memory conditions
A new version of a webapp gets deployed that didn’t have sufficient QA. The result is that the new version of the webapp has memory leaks in some object caching code, and causes the Tomcat JVM where it’s deployed to run out of memory. Ops deployed it to production, trusting that enough QA has been done on the application and there were no major bugs in the new version. Even though there are other webapps hosted in the same Tomcat JVM, the leaky webapp runs the Tomcat JVM out of heap memory.
In this scenario a general purpose monitoring tool might tell you that the offending component is Tomcat, but you already know that, since users have complained and you are already on a bridge call. In some cases, the monitoring software would have alerted you that you are running low on memory, but that is not always dependable, since the memory issues might have resulted from the memory settings configured for Apache Tomcat, and not due to physical memory limitations.
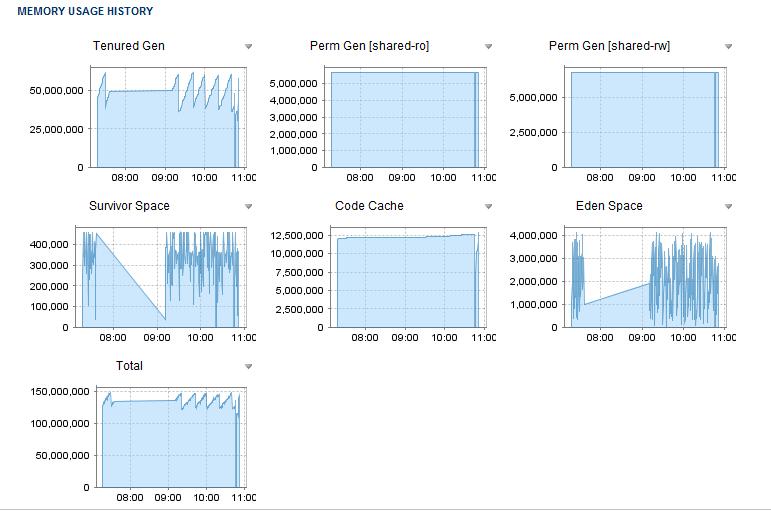
With the proper diagnostics tool, a quick glance would tell you that the Tomcat memory usage is increasing and you are close to the defined maximum, and you can use the diagnostic tool to suggest a GC collection to the JVM. You also want to look at more details of the memory utilization to understand the behavior of the system. You will look at how JVM heap is being utilized, Perm Gen space is being utilized. The graphs of these metrics will provide you with information on how the memory is being utilized over time. This will help you determine if you need to either tune your memory settings or contact your application developer to determine if further application debugging is needed. ( tip: you can stop applications in a development environment to see the impact it has on memory consumption and isolate problematic apps).
As a follow up to this, you might want to examine the application logs for error messages in real time from a central console. One option would be to tail these logs.
Scenario 3: Threading issues
Tomcat request threads call methods in webapp code. If a webapp’s code blocks forever, due to a bug such as a thread deadlock situation, Tomcat’s request threads may all get blocked on the same spot in the code. This can happen when the deadlock bug is in a code path of the webapp’s code that all requests pass through. For example, if there is a singleton state object that all requests must access, and its methods perform write locking, and one thread blocks forever because of an I/O subsystem problem. All subsequent threads end up blocking forever waiting for the lock, and then all of Tomcat’s request threads are blocked, and no threads can answer new HTTP requests.
With a general purpose monitoring solution, you would be alerted that Apache Tomcat has an issue and a particular application is not responding, but it does not often provide enough information to examine the threads and their current status.
With a good diagnostics tool, you would be able to look at all the threads that are currently running (or stuck) on a particular Tomcat instance. You view the list of threads that are on that instance and for blocked threads you want to look at the current context where the thread is waiting. Below screenshot shows an example of how you might do that:
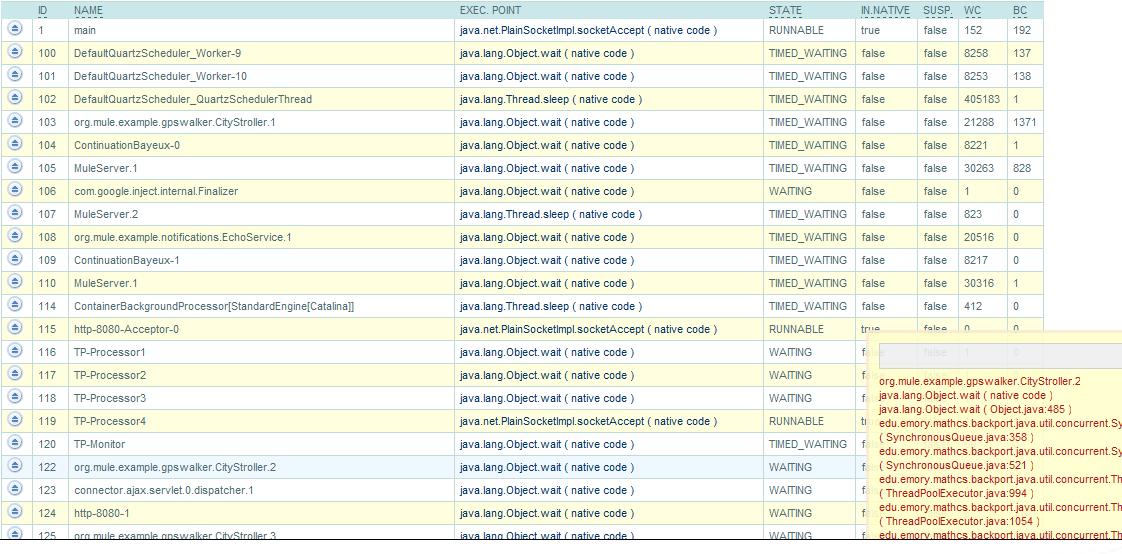
By looking at thread statistics, knowing which threads are blocked and how many times it has blocked will give an understanding of the application thread behavior to determine if you have a threading problem. The context trace will give application specific code where the threading issues might be occurring.
As you can see from these examples, diagnosing problems on Tomcat requires information that is specific to Apache Tomcat and most often the general purpose monitoring tools do not provide this level of information.
If you are looking for help triaging a problem across multiple systems including web browser, network, application servers, databases, storage layers, general monitoring solutions can provide you the data, but beware of the complexity, and determine if your organization is capable of taking on the risk and costs associated with implementing a large general purpose monitoring system. For effective diagnostics for applications, you need specific data that most monitoring tools are not geared to provide.
Note: The screenshots in this article are taken from MuleSoft Tcat Server, an enterprise Tomcat server based on the official Apache Tomcat server, to give you a flavor of what kind of information you need to have to diagnose problems with applications running on Tomcat instance. MuleSoft Tcat Server is free to download and use in development environment.