Anypoint Studio is MuleSoft’s user-friendly integration development environment (IDE) used for designing and testing Mule applications. It has all the capabilities needed for running applications locally and debugging them. It also allows you to test them automatically using MUnit, a Mule application testing framework that allows you to easily build automated tests for your integrations and APIs. MUnit is mostly used for Unit testing, but MuleSoft can also do integration testing in Anypoint Studio.
Using an API-led approach in Anypoint Studio
Mulesoft’s API-led connectivity is based on a tri-layered approach:
- Experience layer: Where the APIs are exposed and consumed by their intended audience
- Process layer: These APIs interact with system APIs, providing aggregation, orchestration and encapsulating business capabilities
- System layer: The APIs access the backend systems and provide a way of insulation
For this reason, we may want to test a flow that starts from an Experience layer, moves into the Process layer, gets the information it needs in the System layer, and comes back from each. We will need to connect and deploy locally three different applications to test them. But how can we do that? Let’s explore the ways we can.
Import the APIs
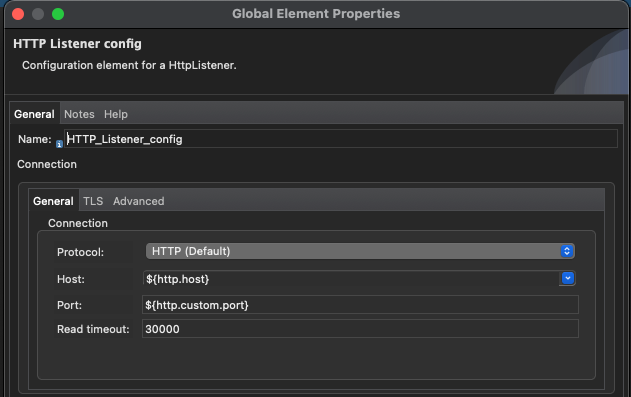
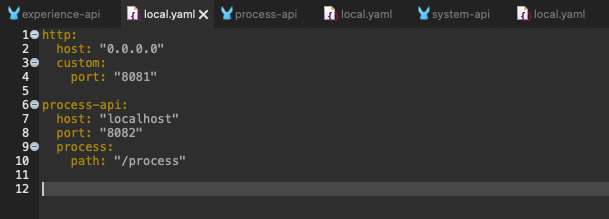
First thing to do is import in Studio all the APIs needed to be tested. Because you are going to deploy all three applications, and because the host for all of them will be localhost, for each HTTP Listener configuration, you have to choose different ports.
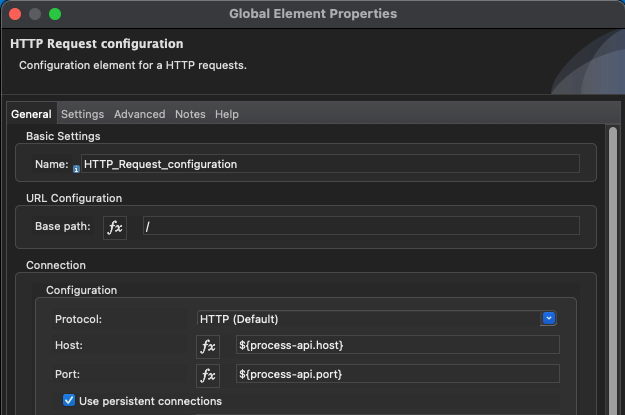
For example, you choose port 8081 for the Experience, 8082 for Process, and 8083 for System layer. And don’t forget about applying the same ports on the respective HTTP Request configuration as shown for the Experience layer:
Repeat the steps with the Process and System app, and you are now ready to start debugging.
Create a new Debug Configuration
Because we want to test all the apps together, we need to create a new Debug Configuration. Right click on one of the applications → Debug As → Debug Configurations:

Then, right click on Mule Applications and select New Configuration.

Properly name the new configuration and select the projects that you want to deploy at the same time; then, click Apply first, then Debug.

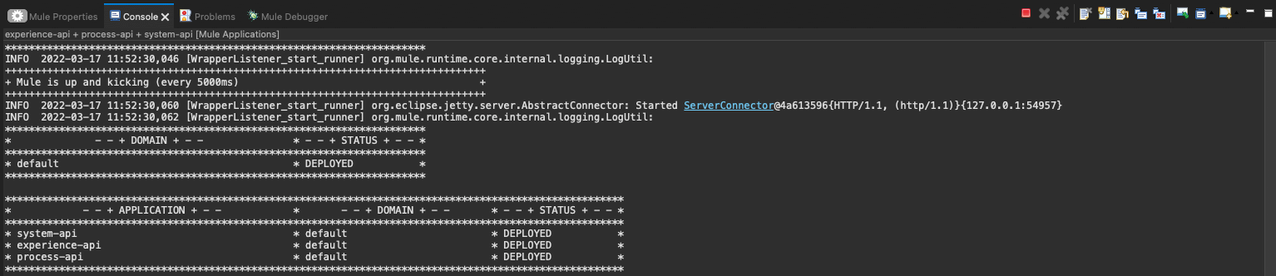
If everything is fine you should see in the Console something like this (below) with the Status of all the applications as Deployed.
Begin debugging
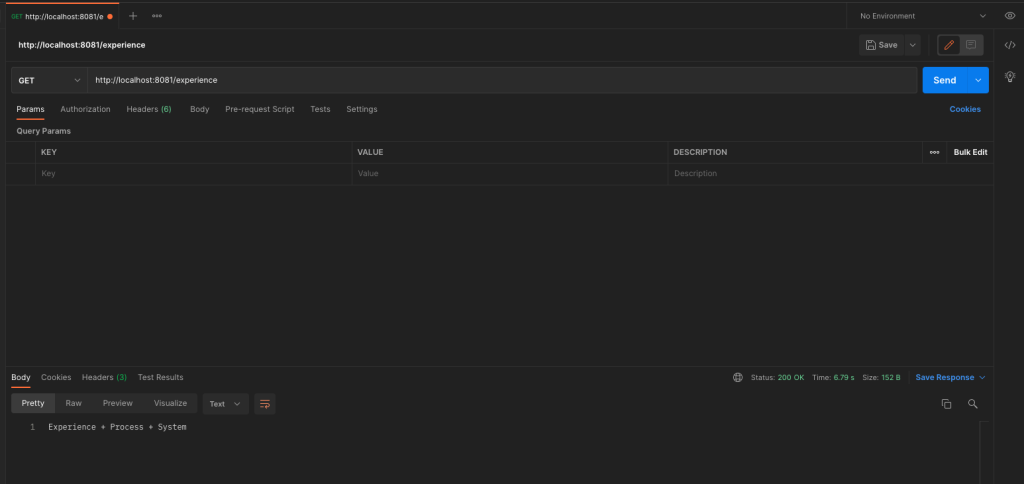
While we’re almost done, we have to use a REST client to perform an integration test.
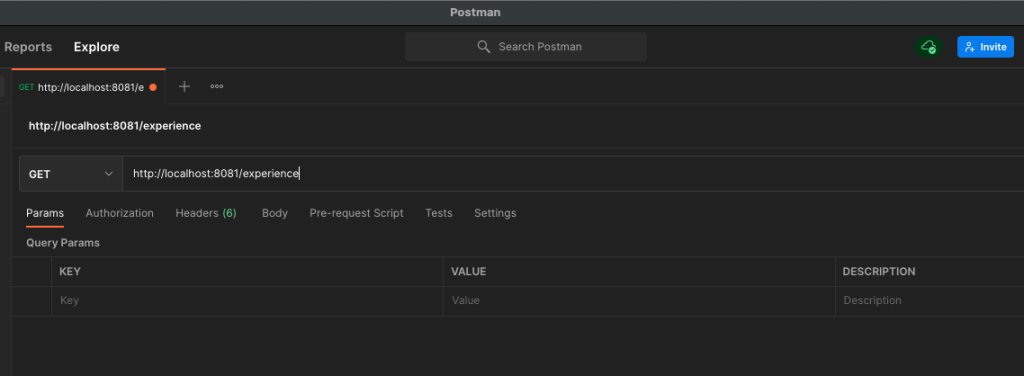
In the URL section, use localhost and the port that you’ve chosen in the configuration, the Method and the Endpoint that you’ve created for your Experience API and send the request.
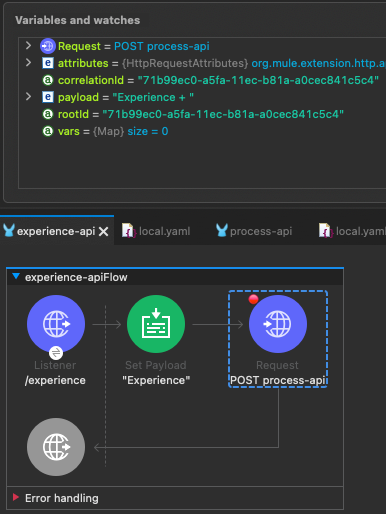
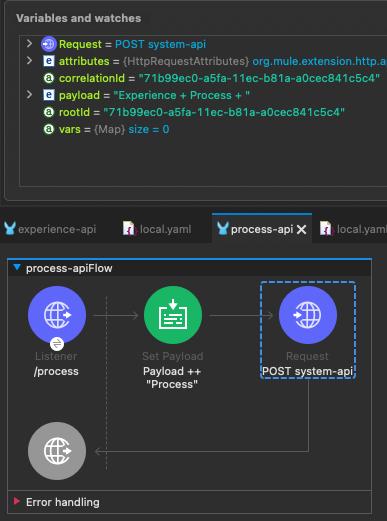
As you can see, we are now able to follow the entire flow down the three layers and we can debug in depth.
In this example it’s not reported, but you can imagine the benefit of having a situation where after retrieving some data from a System API, you can place a breakpoint in Studio right before a Transform Message, and using the Evaluate DataWeave Expression, start working on transformations with real data retrieved from backend systems.
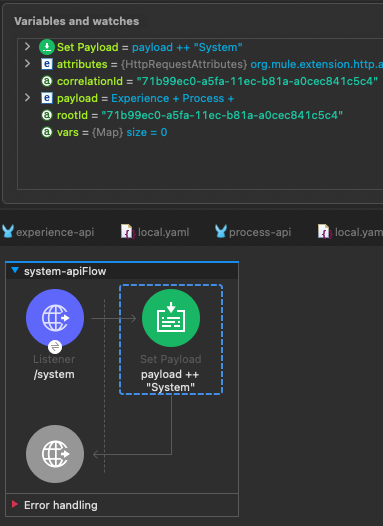
This will be our last response of these demo apps:
Closing tips and information
For each layer, the Correlation ID doesn’t change. It is generated when Mule creates a new event and it enables you to correlate different log entries with a particular execution.
Remember to implement a proper timeout response in the Response section of the Request Palette. The default one is 10 seconds, but it will probably not be sufficient to debug three applications, one after the other.
With a few key steps, you will be able to perform properly integration tests inside Studio, or if a specific flow is experiencing errors or unexpected behavior, you can address the problem directly on Studio and fix it, saving time.