Several years ago, I moved into Product Management, and progressively my time writing code has diminished. Hanging out with the super smart developers at MuleSoft has made me realize how much I missed the days of writing code. So I wanted to get back to doing some code, and what better way to do it than to write a few JSPs? JSPs are easy to write, and you get instant gratification as well.
I wrote a simple JSP that extracts data from an XML file, and it was working fine. When I showed it to the developers, they laughed and told me that I could make the code a lot simpler by using XPath. Sure enough, XPath looked easy enough to use, and I started refactoring my JSP. But during this process, I ran into a nasty bug. It seemed like once in a while, the JSP did not return forever. As any newbie developer would do, I immediately blamed the problem on the XML libraries I am using and started Googling for a solution. Unable to find a solution, I turned to Tcat Server to get diagnostic data.
I launched the Tcat Server console, viewed my application details (I placed my JSP in ROOT context, since this was just a quick and dirty test), and click the JSPs tab.
Screenshot 1 shows the list of JSPs.
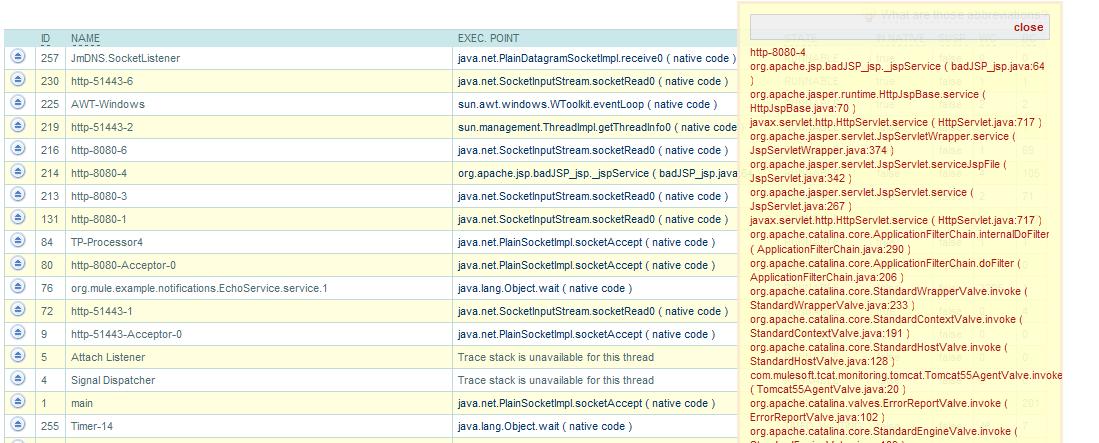
The next step was determining what exactly the JSP was doing. I clicked the Threads tab for that server, and sure enough, there was the thread for my JSP. I clicked the thread’s name to get the current context. The following screenshot shows the current context.
The context shows me that the JSP is at line 64 in the badJSP_jsp.java file. I wanted to know what magic lies at line 64, so I went to the list of JSPs and clicked on badJSP.jsp. I then selected the option to view the ‘generated Servlet’. The following screenshot shows the generated servlet (badJSP_jsp.java):
There it was – the code at line 64, which of course would never return. (Here, I used a sample JSP with bad code for illustration purposes).
In a normal development scenario, you can attach a debugger to get similar information, but attaching a debugger to an application in production is not always possible. However, if your production guys are running Tcat Server, you could log in to the console and with few clicks identify the problem just as I did here.
I’m happy to report that my JSP problems are now fixed, and I will share what the JSP does in a future blog post. Fortunately, I do not have commit rights to the Mule source code repository, so the quality of the software will not be affected by my coding experiments. 🙂
Go ahead and download Tcat Server to see what problems it uncovers for you.


