
In many enterprise MuleSoft applications, Schedulers play a crucial role by triggering jobs such as data synchronization, batch processing, file movement, and more. However, as your ecosystem grows, managing these schedulers becomes increasingly challenging.
Questions like: “Is my scheduler running?”, “When was it last executed?”, and “Did it fail?” often go unanswered unless you comb through logs or use external monitoring tools.
What we'll cover in this article: We’ll walk through implementing a Scheduler dashboard in MuleSoft to centrally monitor and manage scheduled flows with minimal effort – furthering it by integrating AI-powered insights to detect anomalies, predict failures, and optimize scheduling.
Why use a scheduler dashboard?
While MuleSoft provides robust logging and monitoring with Anypoint Monitoring and Anypoint Runtime Manager, these tools may not provide real-time, scheduler-specific dashboards out of the box.
A custom dashboard provides:
- Centralized visibility of all scheduler executions
- Next run times and last execution time tracking
- Failed runs and error message logging
- Performance metrics like average run duration
- Debugging support for failed or skipped executions
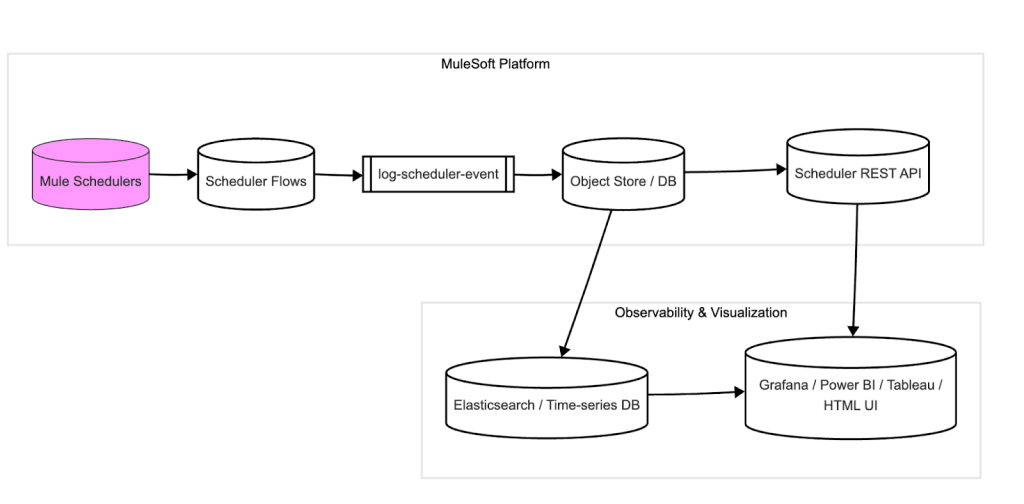
Architecture overview
Here’s what we’ll build:
- Scheduler Metadata Tracker Flow
- Persistent Storage for Scheduler Logs (Object Store or DB)
- REST API to expose scheduler status
- Custom Dashboard (optional – using tools like Grafana, Tableau, Power BI, or a simple front-end)
Tracking scheduler events in Mule Flows
Each scheduled flow should be updated to record its status in a shared resource (object store or database).
Basic Scheduler Flow with tracking example
<flow name="scheduler-job-1">
    <scheduler frequency="60000" timeUnit="MILLISECONDS" doc:name="Scheduler"/>
    <set-variable variableName="startTime" value="#[now()]" doc:name="Set Start Time"/>
    <try>
        <logger level="INFO" message="Scheduler Job 1 started."/>
        <!-- Your core business logic here -->
        <set-variable variableName="status" value="'SUCCESS'"/>
    </try>
    <catch-exception-strategy>
        <set-variable variableName="status" value="'FAILED'"/>
        <set-variable variableName="errorMessage" value="#[error.description]"/>
        <logger level="ERROR" message="Scheduler Job 1 failed: #[error.description]"/>
    </catch-exception-strategy>
    <finally>
        <set-variable variableName="endTime" value="#[now()]"/>
        <set-payload value="#[{
            jobName: 'scheduler-job-1',
            startTime: vars.startTime,
            endTime: vars.endTime,
            status: vars.status,
            errorMessage: vars.errorMessage default null
        }]"/>
        <flow-ref name="log-scheduler-event"/>
    </finally>
</flow>
Persisting scheduler logs
Create a common sub-flow that all scheduler flows can call to log their execution.
log-scheduler-event Flow example
Using Object Store (Simple):
<flow name="log-scheduler-event">
    <object-store:store
        key="#[payload.jobName ++ '-' ++ now()]"
        value="#[payload]"
        objectStore="schedulerLogsStore"
        doc:name="Store Scheduler Log"/>
</flow>
Database (Advanced and Preferred): Use a DB connector to insert the payload into a monitoring table.
Exposing a REST API to retrieve logs
Create an API that allows you to query scheduler logs for each job.
<flow name="get-scheduler-status">
    <http:listener config-ref="HTTP_Listener_config" path="/scheduler-status" doc:name="HTTP Listener"/>
    <db:select doc:name="Query Scheduler Logs">
        <db:sql>SELECT * FROM scheduler_logs ORDER BY start_time DESC LIMIT 50</db:sql>
    </db:select>
    <json:object-to-json-transformer/>
</flow>
Visualizing the data
First, use your preferred visualization tool:
- Built-in HTML dashboard (basic): Build a lightweight HTML UI using MuleSoft’s static resource handler to display job data
- Tableau/Power BI/Grafana/Kibana: Push your logs to Elasticsearch or expose via API and use BI tools to render dashboards like:
- Job execution timelines
- Error trends
- Scheduler health overview
- Average execution time per job
How to implement AI in MuleSoft
Train an ML model outside MuleSoft: Use platforms like Azure ML, AWS SageMaker, and Google Vertex AI; Python (scikit-learn, TensorFlow, PyTorch).
Train a model on features like:
{
  "jobName": "scheduler-job-1",
  "dayOfWeek": "Monday",
  "startHour": 14,
  "duration": 12.4,
  "status": "SUCCESS",
  "errorType": null
}
Train it to predict: Likelihood of failure, expected duration, and anomaly score
Expose AI as a REST API: Deploy your trained model and expose it via a REST endpoint (e.g. using FastAPI, Flask, or cloud services).
Call AI API from MuleSoft:
<http:request method="POST" url="https://ml-api.company.com/predictFailure">
    <http:body><![CDATA[#[{
        "jobName": "scheduler-job-1",
        "dayOfWeek": now().dayOfWeek,
        "hour": now().hour
    }]]]></http:body>
</http:request>
Use the response to alert stakeholders if failure probability > 80%; skip or reschedule a job dynamically; and auto-trigger a retry with backup logic.
Real-time alerting based on AI:
<choice>
<when expression="#[vars.failureProbability > 0.8]">
        <flow-ref name="send-alert-email"/>
    </when>
    <otherwise>
        <logger level="INFO" message="Scheduler proceeding as normal."/>
    </otherwise>
</choice>
The transformative impact of AI on MuleSoft Scheduler Dashboards
By integrating AI into your MuleSoft Scheduler Dashboard, you empower your platform with self-awareness and foresight. No more just logging what happened; you can now predict what might happen and take action before it does. Plus, if you’re already capturing scheduler data, you’re halfway there. With a small ML model and API call, you can elevate your operations with real-time intelligence.
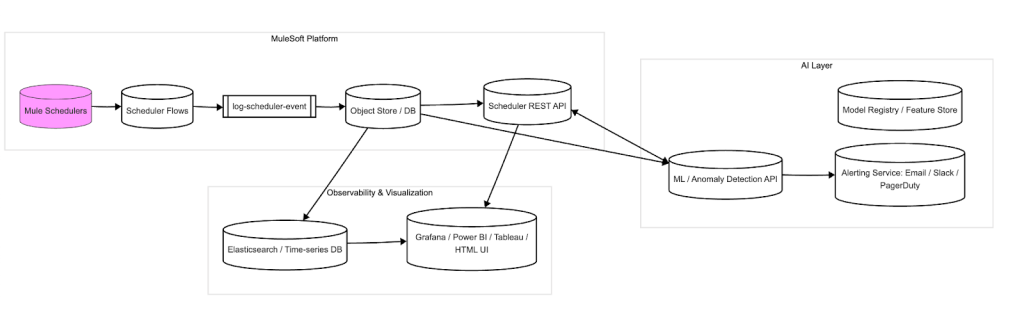
Final architecture overview:
Next steps:
- Add consistent logging to all scheduled flows
- Train and deploy a basic anomaly detection model
- Integrate your model API into MuleSoft flows
Editor’s note: This article was collaboratively written by Sravan Kumar Vazrapu (Senior Engineering Manager), Kishore Reddy Kuppuru (Lead Engineer), Sudhanshu Joshi (Lead Engineer), and Anusha Ganji (Senior Developer).


