
The latest release of Anypoint Code Builder (June 2024) includes the ability to run, debug, and troubleshoot existing MUnit tests in your Mule projects.
For those who are just getting started with MuleSoft, MUnit is an application testing framework that allows developers to build automated tests for their integrations and APIs easily. Developers can now easily migrate any existing MUnit tests built in Anypoint Studio to Anypoint Code Builder (ACB) to run against new Mule projects.
While you can’t use ACB to create new MUnit tests from scratch, you can use the XML editor to modify your existing MUnits. The best part is that you can find all your tests under the same tab in Visual Studio Code: the testing tab. From here, you can now natively run, debug, and fix any failed tests.
You can use this Mule project, which contains a few MUnit tests, to explore this new functionality. Please note that you will need Enterprise Maven Repository credentials to access this feature. To learn how to set this up, please read our help guide on how to use Enterprise Maven Repository credentials with settings.xml and pom.xml and check out this example file for more hands-on guidance.
Testing tab
Inside Visual Studio Code, you will find the Testing tab in the Activity Bar, located on the left side of the screen by default. Once you click on this, you will be able to see the available tests in your Mule project.
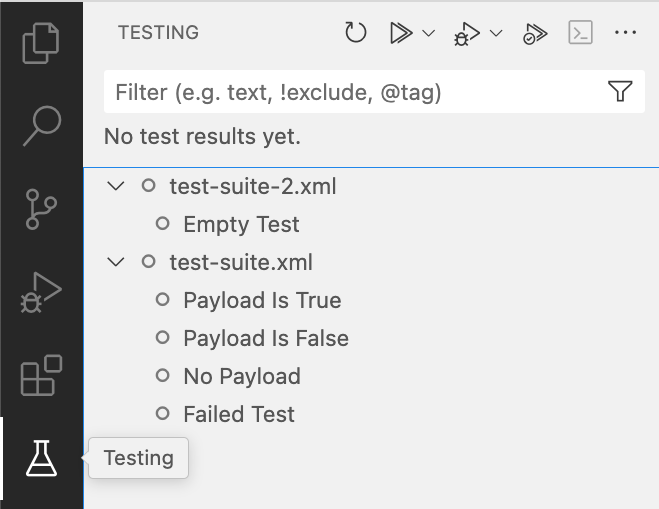
At the top of this screen, you’ll find a few buttons and options for your tests:
- Refresh Tests
- Run Tests
- Debug Tests
- Run Tests with Coverage
- Show Output
- Views and More Actions
Hover your mouse over the actual tests (or test suite) to find additional actions for the individual test or test suite that is currently selected.
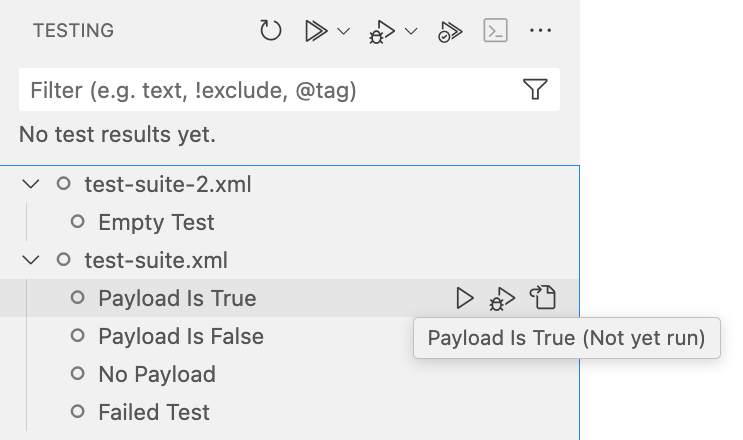
These buttons include:
- Run Test (or test suite)
- Debug Test (or test suite)
- Go to Test (or test suite)
Let’s explore some of these options in a bit more detail.
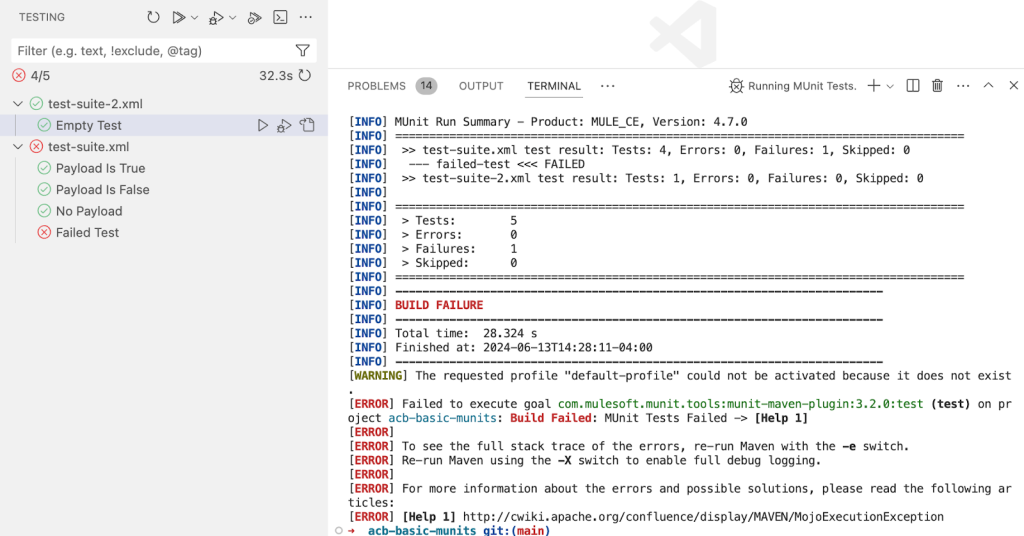
Run tests
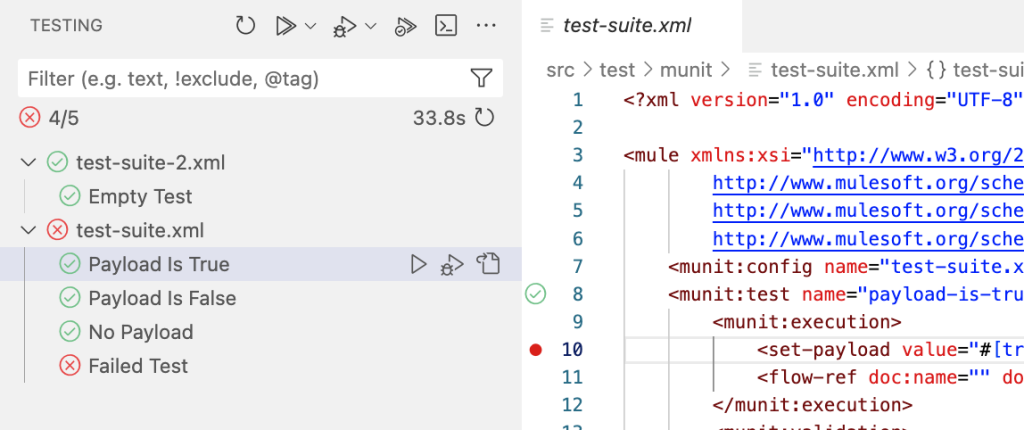
Use the Run Tests button at the very top of this window to run all the available tests throughout all the test suites. In the following example, we have one failed test which results in a build failure.
So, how can we explore this failed test to see what went wrong without having to debug? Showing the output of the last build.
Click on the Show Output button at the top of the window (next to the three-dot button). This will show all the test runs and their respective results (success/failure).
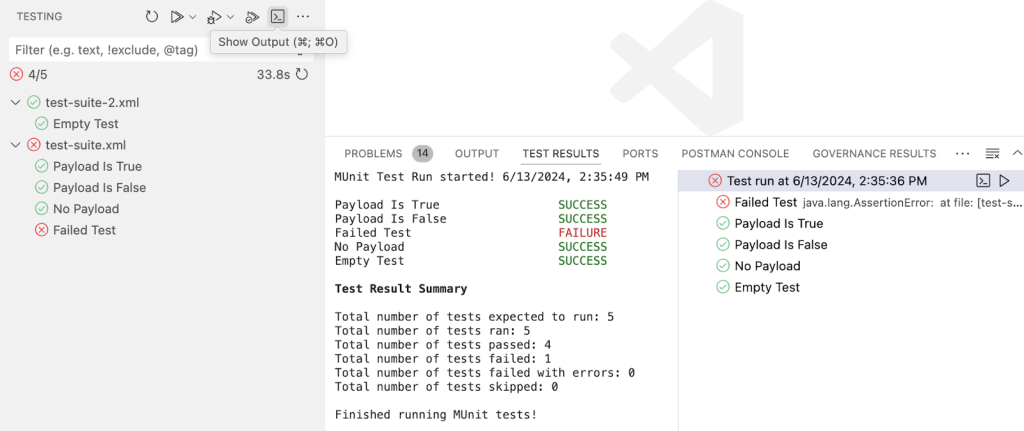
From this view, you can click on the specific failed test that you want to show the results from.
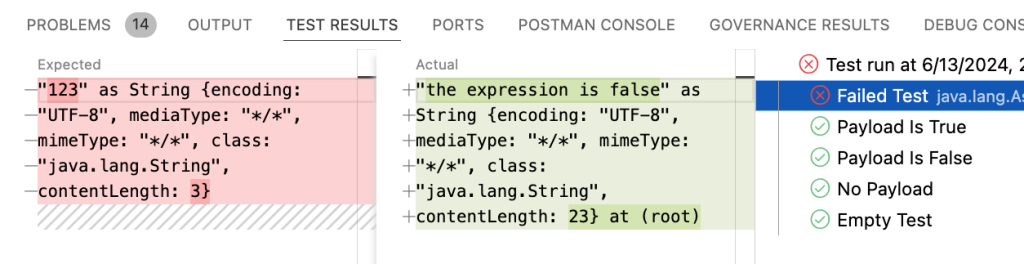
Now you can clearly see what is the expected vs. the actual result. In this case, the test was expecting to receive “123” but the actual result received was “the expression is false”.
This comes in handy when there is no need to debug the whole test and you just want to be able to see the results of what failed. But what if you actually want to debug?
Debug tests
Please note that in this version of ACB, you can only debug your MUnit tests when using the Mule runtime enterprise edition (not the community edition). You can add the following line to your mule-artifact.json file to ensure you are running this version. Here’s an example of what this looks like.
"requiredProduct": "MULE_EE"
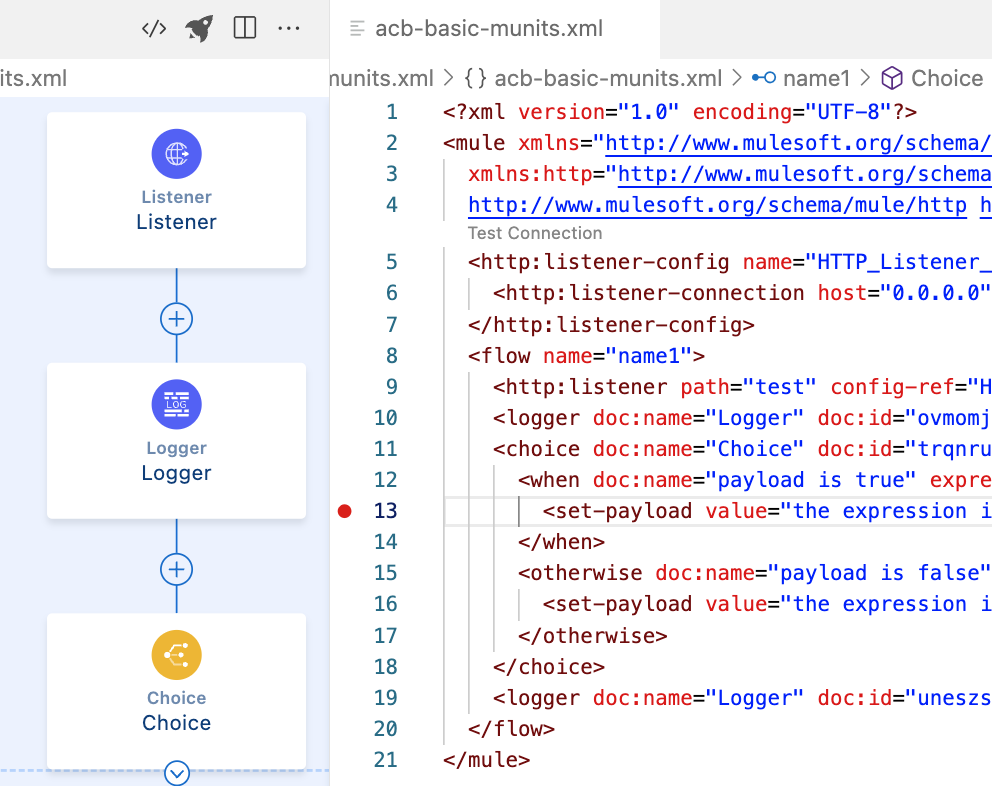
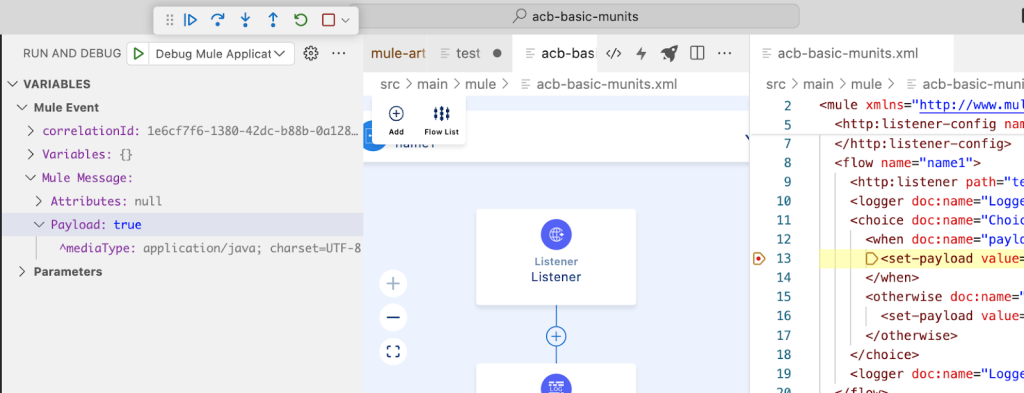
When we debug tests, we usually want to set up some breakpoints to make sure the debugging session stops exactly where we want. In this case, our breakpoints are added in the XML view of the files. This might change in future functionality, but for now, you can use the Go to Test button next to the test you’d like to open. After that, you can simply click next to the line number you want to add the breakpoint to.
You can also add a breakpoint in the Mule flow by using the XML view. Here’s an example of how this would look like:
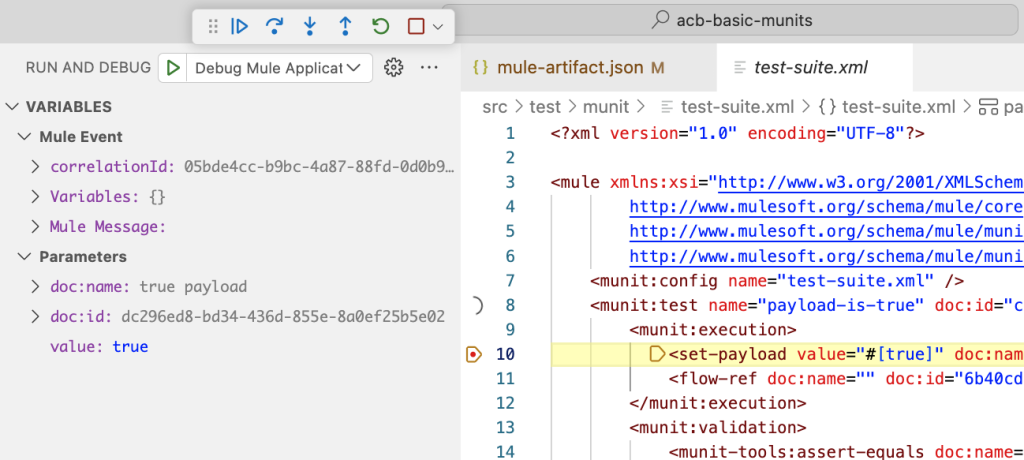
In this case, because we only want to debug one test, we can hover over that single test and click on the Debug Test button. Once the runtime has been initialized, we will see the appropriate debugger with its controls at the top of the window and our execution will be paused at the breakpoint.
The debugger now shows the following buttons:
- Continue
- Step Over
- Step Into
- Step Out
- Restart
- Stop
In this example, once we click on Continue, it will continue the execution of the test and will now stop at the next breakpoint.
We can also take a look at what’s inside the payload by navigating to the left side of the screen, under Variables > Mule Event > Mule Message > Payload. In this case, the payload contains the value true.
Isn’t this a huge improvement to be able to run, debug, and troubleshoot your tests in ACB?
A step forward
With the latest release of Anypoint Code Builder, MuleSoft developers can now easily leverage their existing MUnit tests against projects in ACB. This is our first step toward offering comprehensive unit testing within the tool, and we’re excited to continue innovating and refining the end-to-end integration experience for our developers.
The ACB team is continuously gathering feedback to improve the tool in future releases. Check out the following resources to learn more about Anypoint Code Builder and to send your feedback:


