
This blog post was written by one of the stars in our developer community, Kian Ting.
1. Overview
I have created a Mule application that pings URLs to ensure that the URLs are up. And if the URL is down for one reason or another, then the Mule application is capable of sending out an email notification. At the time of this writing, the Mule application could send out an email notification, and I plan to incorporate more notification types as I continue to improve the project.
You can obtain the source code via Github.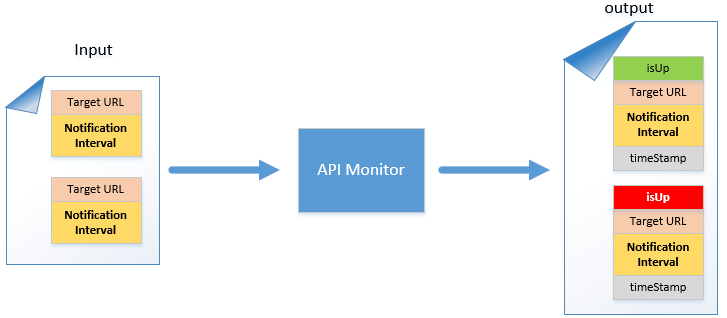
Figure 1.0
Figure 1.0 shows an abstract diagram of what the API monitor expects. Users would submit a JSON payload consisting of an array of target URLs, which will be pinged by the API monitor. In conjunction with the target URL, users also need to specify notification interval. The notification interval is useful in that users won’t be spammed with notification messages if the ping is very frequent (e.g. every 5 seconds).
For instance, if the notification interval is set to 1 hour, and users are trying to ping a target URL that is down every minute, and the target URL is down for 2 hours, then users would essentially only receive 2 notification emails (instead of getting one email every minute where the target URL is down). Figure 1.0a shows an example of an input payload.
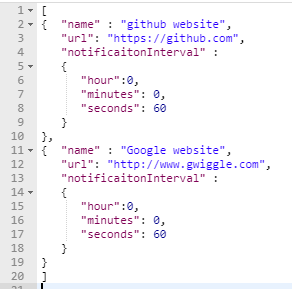
Figure 1.0a
If the URL is pingable, then the API monitor would set isUp to true (green); otherwise, it would set isUp to false and send out a notification to the user. The output payload from API monitor would contain enriched data, including the timestamp of the pinged URL and also the status of the URL.
The returned notification timestamp would be the same as the previous notification timestamp if the notification interval has not expired. If the notification interval has expired, then it would be updated with a new timestamp.
The output JSON payload would also have the latest timestamp on the current ping attempt. Figure 1.0b shows an example of a JSON output payload.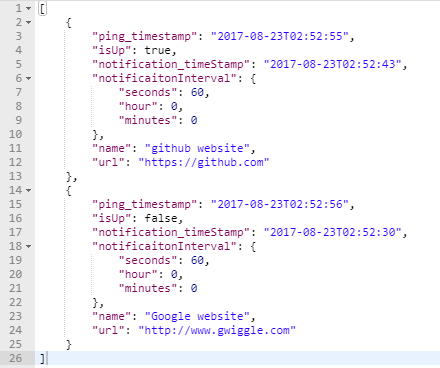
Figure 1.0b
2. Using flow designer to automate pinging
Now that you have an API monitor that is capable of pinging URLs and sending out email notifications if the URL is down, the next step is to automate the pinging. We can easily achieve this via Anypoint Design Center’s Mule flow (assuming that you will be deploying the API monitor into CloudHub). Let’s see how we can achieve this; first, from CloudHub you have to select “Design Center” (as in Figure 2.0).
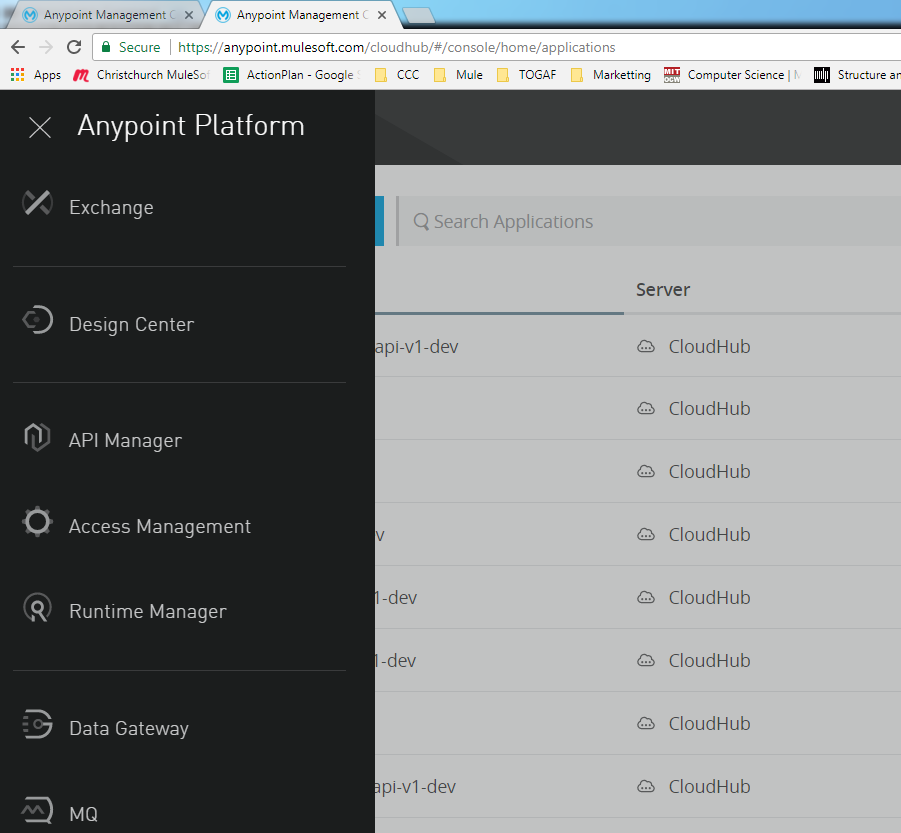
Figure 2.0
In Anypoint Design Center, click on the create button on your right (Figure 2.0a), and select Mule Application.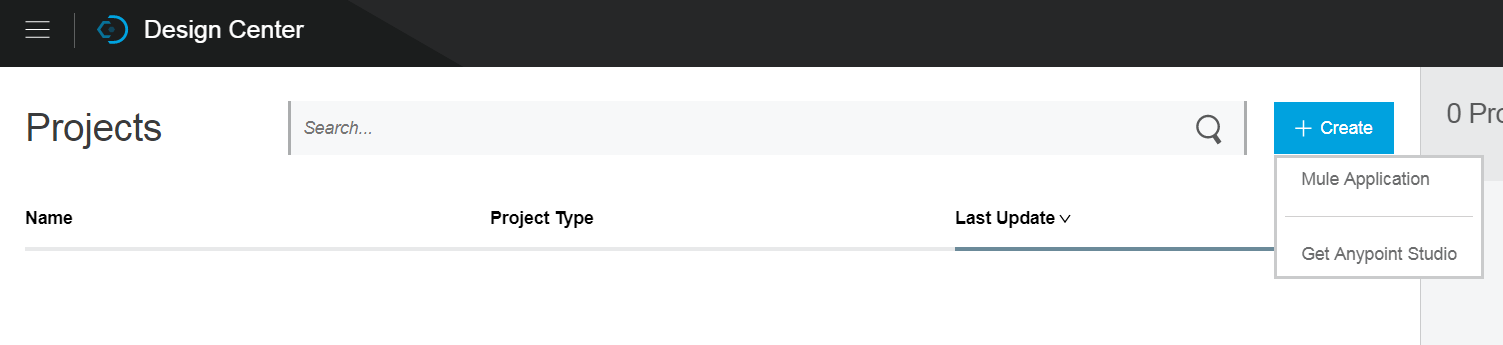
Figure 2.0a
You will then be prompted with a pop-up dialog, key in the same text as per depicted in Figure 2.0b.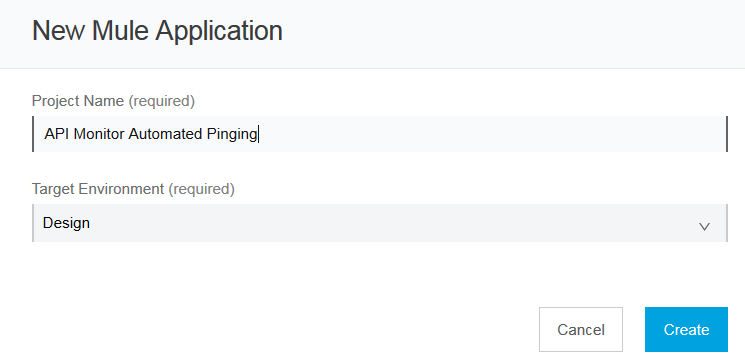
Figure 2.0b
Select scheduler as the first component and set it to 10 seconds, as per Figure 2.0c.
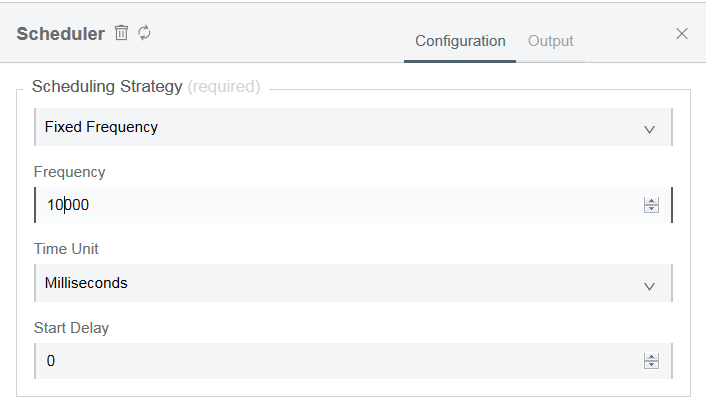
Figure 2.0c
Next, select an HTTP requester component, key in the URL as per Figure 2.0d.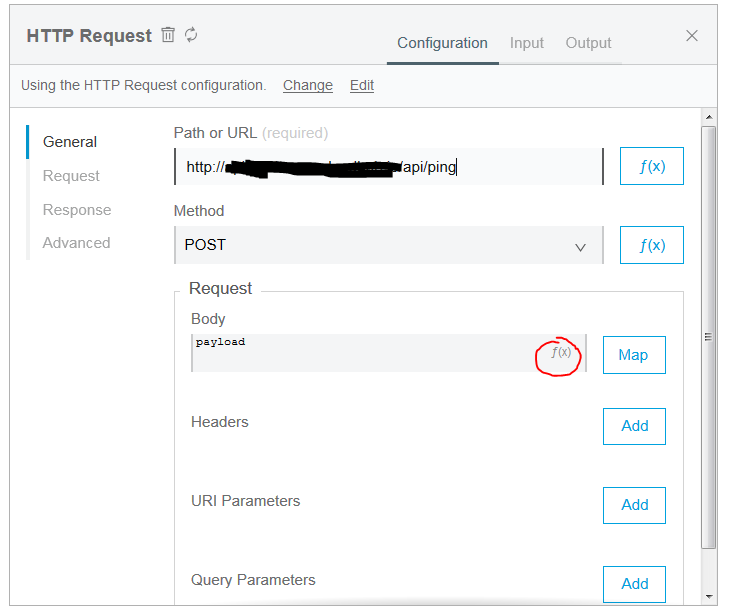
Figure 2.0d
Then, if you see a text box marked with f(x) on the right-hand side – similar to the one you see in Figure 2.0d – it means that it accepts the DataWeave expression. Flow designer Mule applications run on Mule runtime 4, to learn more check out the following resources.
- Extracting component of Mule Event
- F(x) Expression explained
- Dataweave syntax explained
The resources above are all for Mule 4. You need to click on the map button next to the f(x) sign (Figure 2.0d). When you click on the map button, you will see the following pop-up dialog in Figure 2.0e.
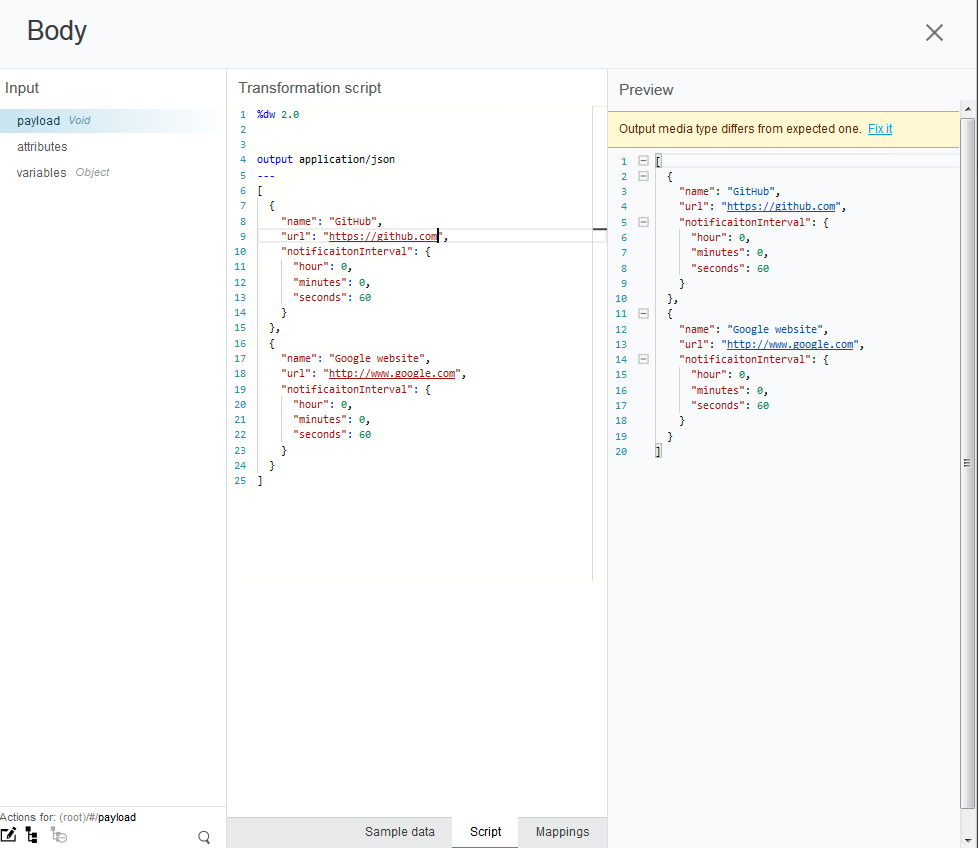
Figure 2.0e
Click on the script tab and cut-and-paste your desired payload into the middle pane. This will be the payload that will be submitted to the API manager at 10 seconds intervals in order to ping the list of URLs you have specified in your payload.
When you finish your flow designer configuration, you will see the following:
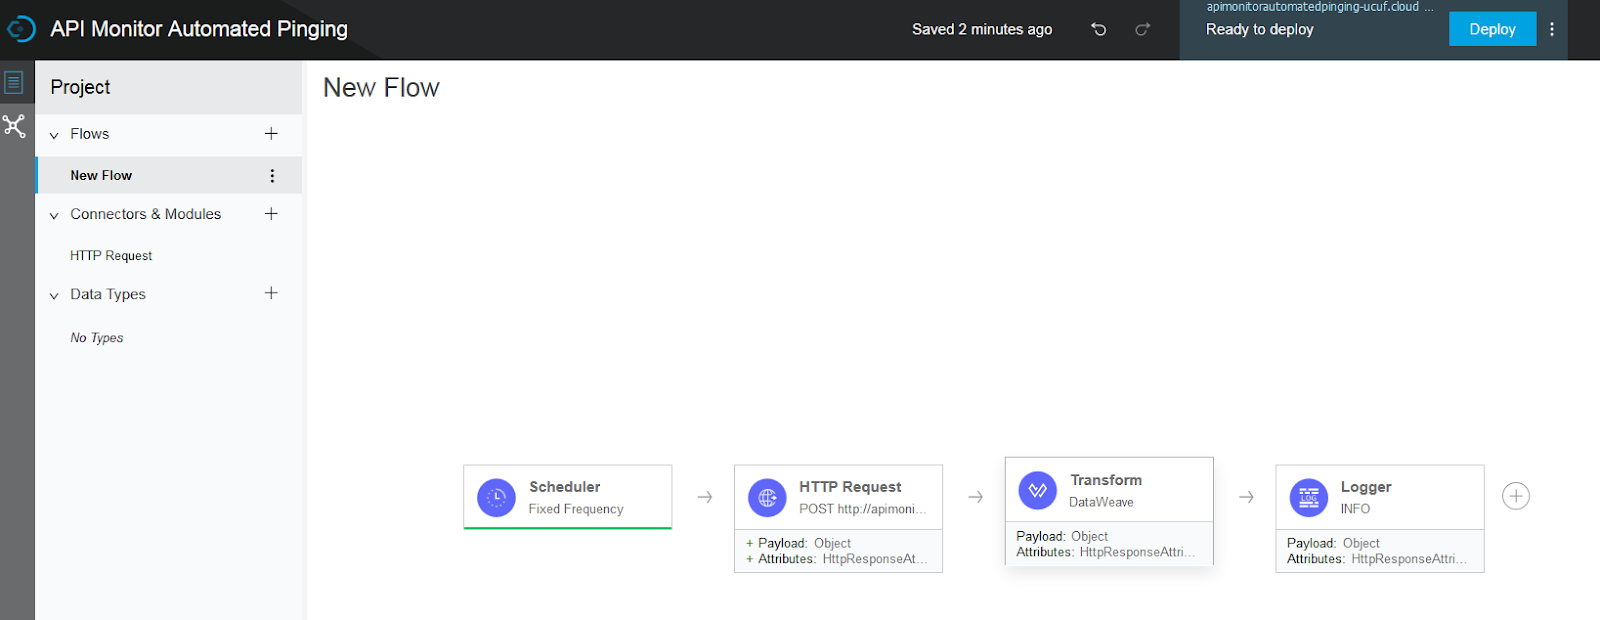
Figure 2.0f
You need to click on the deploy button on the top right of the screen, as shown in Figure 2.0f. Once the application is deployed, you will see a small green line that marks all the message processors. This indicates that these processors have been executed successfully, as shown in Figure 2.0g.
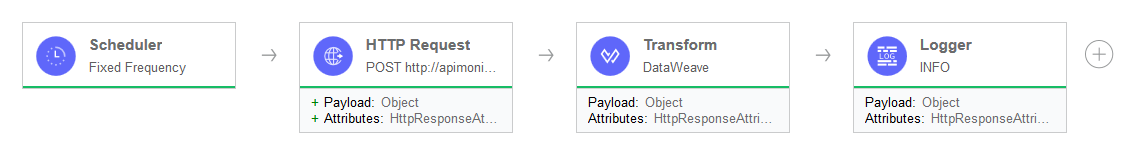
Figure 2.0g
3. Running a flow designer application
After you click deploy at Figure 2.0f, CloudHub will deploy an instance of your flow designer Mule application in Runtime Manager. If you go to your Runtime Manager in CloudHub, you will see your application, as in Figure 3.0a.
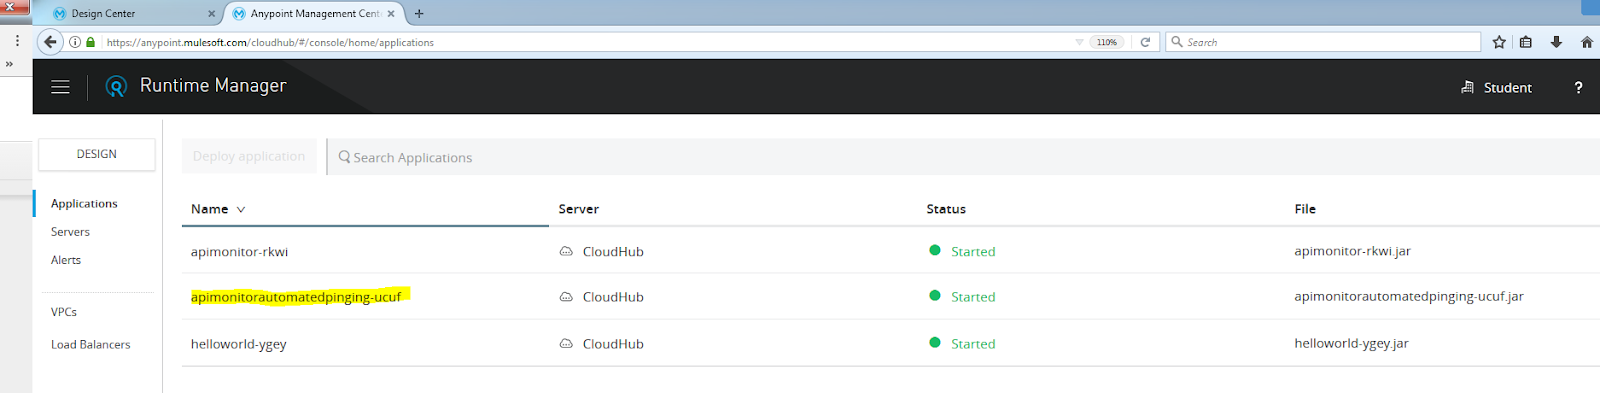
Figure 3.0a
If you click on the application and browse the Logs Menu (as in Figure 3.0b), you will see the output payload returned by the API monitor application, which was created earlier.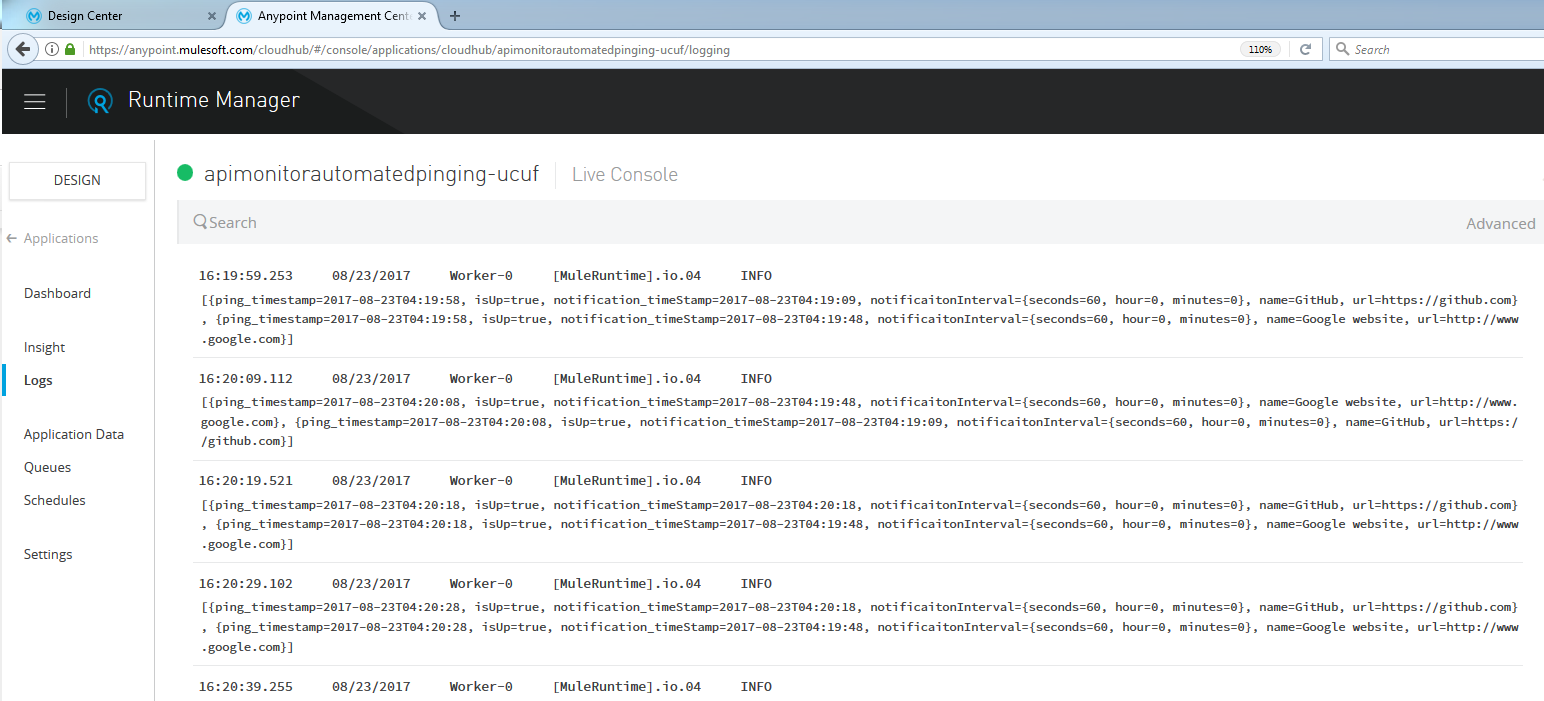
Figure 3.0b
4. Conclusion
If you follow all the steps in the earlier sections, your flow designer application is actually running in the Anypoint Center Design environment. You can easily download and version your application via the download icon on the top right of the CloudHub screen, and you can also promote it to other environments by clicking on the promote icon.
And that’s how you can easily automate URL/API monitoring!


