Monitoring your applications and infrastructure is key for a good digital experience and success of your business. Alerts provide key health and performance metrics of your application and infrastructure. You need an alerting practice to proactively discover issues and quickly resolve them. Monitoring service level agreement metrics using alerts can help benchmark your current performance and set your goals and milestones to achieve the needed performance. Doing so reduces the likelihood of downtime and sub-optimal performance. To acheive all these goals, you need design guidelines and best practices to create alerts.
Alerts design best practices and guidelines
An alert monitors metrics and sends notifications of a potential problem, when the monitored metric falls below the threshold, exceeds the threshold, or goes outside the defined range in a given timeframe. Even though many organizations have adopted alerts practices, they are not following the design guidelines and best practices for creating alerts, which simply produces a sea of noisy data. The following are the design guidelines and best practices for creating alerts.
Establish an alerting process
Establish an alerting process by documenting the alerting policies and making sure they are followed. Alerts should take the form of tickets, so prioritization, tracking and event response is part of the process of alerting. Document the plan of action to take when you get an alert in the operation runbook so the support is aware of the steps to take. The goal should be that the infrastructure can handle capacity, APIs have fewer bugs, and the infrastructure becomes more reliable.
Create applications and infrastructure alerts
Create applications and infrastructure alerts as both are very important for stability and performance of your applications. You should configure alerts when key health or performance metrics of your applications and infrastructure go beyond a specified threshold which would indicate an issue. Make sure you have at least covered all critical applications and infrastructure.
Quality alerts
Quality of alerts is much more important over the quantity of alerts. You could get overwhelmed with so many alerts that you start to ignore them. Monitor metrics and fine tune the rules to keep a good balance between too few or too many alerts. Create actionable and impactful alerts that require engagement and response. In most cases, a combination of availability, percentage utilization, response time and error rate metrics are good measures of health of the applications and infrastructure.
Categorize alerts properly
Properly categorize your alerts into informational, warning and critical alerts, so it is clear the type of attention the alert needs. Based on alert categories, you should be able to decide if you need to proactively avoid a failure versus resolve an error or outage.
Include clear and concise notification details
Clear and concise notification details should be included in the alert which should target the resources who need to act on the alerts. Make sure the information is available to understand the issue and have additional tracing in logs to troubleshoot and resolve the issue.
Fine-tune alert thresholds
When the thresholds are set up too liberally, legitimate problems may not be detected in time and the system runs a greater risk of performance degradation. In the end, this may lead to system downtime. When the problems are eventually discovered and mitigated, the alerting configuration should be tightened to prevent the recurrence of costly outages.
Alarm thresholds can also be created with unnecessarily sensitive thresholds, leading to a high likelihood that an alarm will be triggered by normal system operation. In such scenarios, the alarms will generate alerts when no harm is done. Once again, the baseline should then be reevaluated and respective monitors adjusted to improve detectability of real issues.
Create reports and dashboards
Reports and dashboards provide visibility into the health of the overall system to review the number of issues and related alerts. You can fine tune and check the breadth of these alerts. Also, this data gives you a deeper look at the availability and repeating issues on APIs. Allowing you to identify usage trends to allocate resources and ensure you can prevent issues before they occur.
Reports and dashboards allow you to share key information with internal stakeholders. Regular monitoring means you can quickly prove that the KPIs have been met and justify the correlation between an action and an outcome. This helps you to uncover how the IT department drives value and what can be improved to support the ongoing enhancements. Sharing these insights provides stakeholders with the information needed to make strategic decisions.
Viewing historical information in reports enables you to collect crucial data on your infrastructure, APIs, and monitor trends. Having access to this data allows you to conduct trend analysis so help improve the knowledge of your IT infrastructure and APIs.
Now that we’re aware of the alert design guidelines and best practices, let’s look at out-of-the-box functionality offered by Anypoint Platform to create alerts.
Anypoint Platform alerts
Government Cloud Anypoint platform lets you configure and define custom alerts from Monitoring and Runtime Manager.
Anypoint Monitoring alerts
Application monitoring alerts can be set up with metrics like message counts, message error count, message response time, thread counts, CPU and memory utilizations. Server alerts can be set up for thread counts, CPU and memory utilization.
Anypoint Runtime Manager alerts
Runtime Manager alerts include several standard alert types that trigger notifications for common events such as an application exceeding a specific number of events, a deployment success or failure, server being disconnected or deleted, etc.
Creating an alert
When creating an alert, keep the alert design guidelines in mind and follow these instructions below:
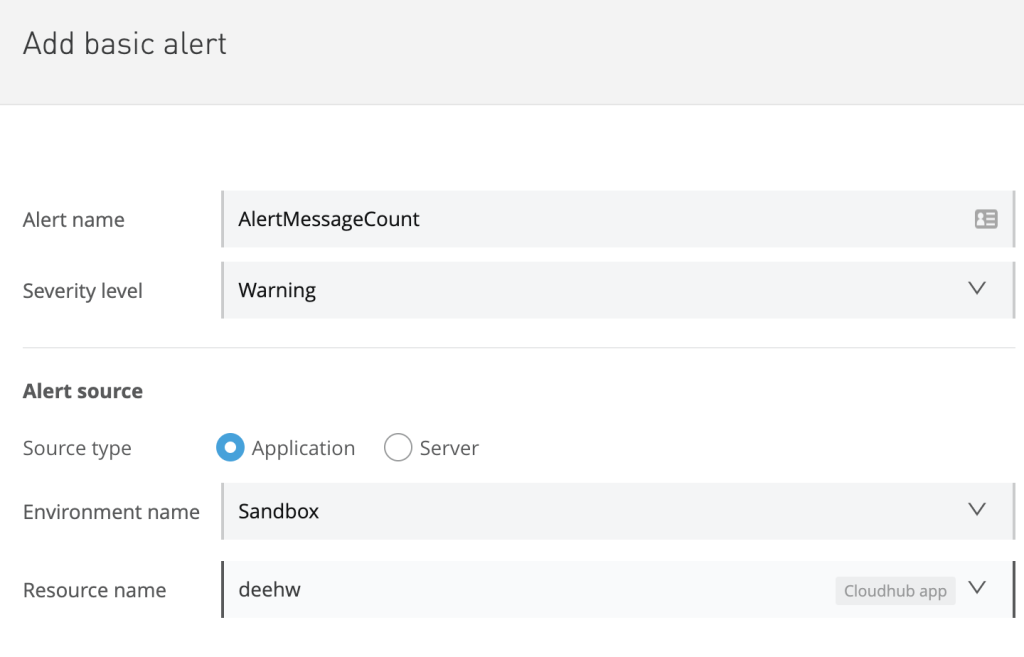
- Add the name for the alert
- Select the severity level: Informational, Warning, or Critical
- Select the source type of alert: Application or Server
- Select the environment name
- Select the resource name
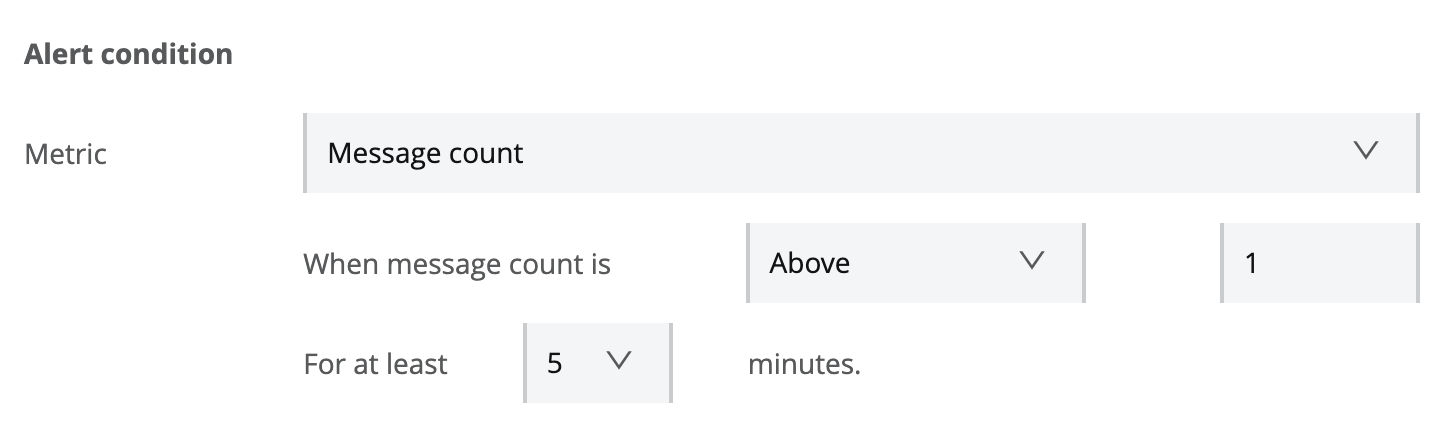
- Select the metrics to be monitored and carefully configure the threshold rules to trigger the alerts
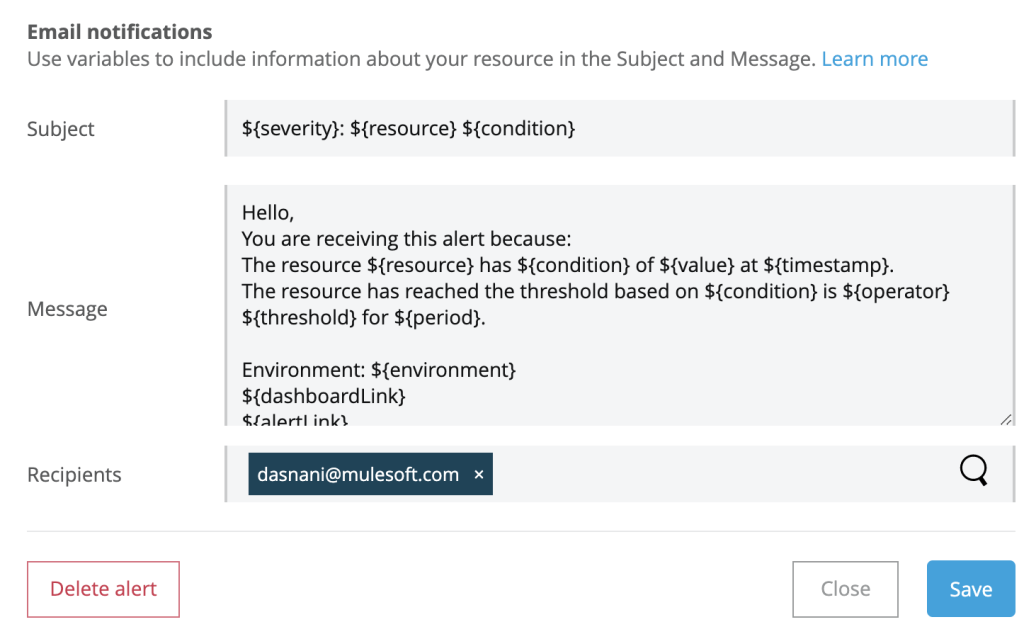
- Define the email subject, message, and email addresses of the groups who need to be notified
[blog_posrt_ads]
Conclusion
We look forward to organizations creating alerts following the design guidelines and best practices using MuleSoft Anypoint Platform’s out of the box functionality, to provide a better digital experience to your organization.
Also look into Anypoint Monitoring which gives granular visibility into all insights related to APIs, integrations, and dependencies that are extracted automatically, with very low-performance overhead and no required application modifications.
More than 40 metrics are available through built-in dashboards, covering everything from inbound requests, outbound calls, and dependencies to performance, failures, JVM, and infrastructure metrics.
Learn more with our video that covers five initial steps to operationalize monitoring in your organization: