Reading Time: 17 minutesMost of our customers are using Tcat to build APIs. Anypoint Platform combines Tcat’s ease of use with built-in management and support. Whatever you’re building and deploying on Tcat, Anypoint Platform gives you agility, reusability, and transparency. Give Anypoint Platform a try for 30 days and see what you think.
Last update: June 20th, 2017
For those of you who develop in Eclipse, and are also running Tomcat as a stand-alone JVM process (the way Tomcat is usually run), it is fairly easy to debug your web applications using the Eclipse debugger. For that matter, you could also debug Tomcat’s code this way as well, if you want to inspect what Tomcat is doing with a request.
I am often asked for help to figure out why Tomcat is malfunctioning. After digging into the details of how the person asking for help is running Tomcat, I find out that they are running Tomcat from within the Eclipse JVM, or spawning a new JVM via an Eclipse plugin. In these situations, it is almost always the case that the integration of running Tomcat directly from Eclipse caused the problem. As soon as the person I’m helping tries running Tomcat as a stand-alone process, and tries their webapp on that, it works. There are probably ways to fix each of the Eclipse embedded Tomcat implementations, for each version of each plugin, but if running Tomcat as a separate process Just Works, then for most users it probably makes the most sense just to run Tomcat as a separate process and debug it that way.
Once you have Tomcat running successfully as a separate process, and your webapp happily running on it, you can begin configuring remote debugging. The Eclipse JVM process will make a local network connection to the (separate) Tomcat JVM process. There are two items to configure to make this work:
- Enable the JPDA debugger server in your Tomcat JVM
- Configure your Eclipse’s JPDA debugger client to connect to your Tomcat JVM
Enabling the JPDA Debugger in your Tomcat JVM
The Tomcat JVM is no different than any other JVM — it is a regular Java runtime, and the JDK/JRE already supports a JPDA debug server. To enable the JPDA debug server, you only need to start the JVM with a startup argument that enables it. This does mean that you must restart the JVM to enable it, but especially in development, this tends to be okay. The standard JVM startup argument looks like this:
-agentlib:jdwp=transport=dt_socket,address=8000,server=y,suspend=n
This tells the JVM to start a JPDA debugger server that only allows TCP connections over port 8000, and then only from the local machine. From outside of the machine, it is not possible to connect to port 8000.
A somewhat older but equivalent startup switch is:
-Xrunjdwp:transport=dt_socket,address=8000,server=y,suspend=n
You can use either one of these (only use one, not both).
When Tomcat’s stock catalina.sh or catalina.bat script runs, the script invokes the java binary, and then loads and starts Tomcat’s code. To enable debugging, you need to pass the JPDA server settings details to Tomcat’s catalina script. The suggested way to enable the debug server is to invoke the catalina script with a command to start the Tomcat JVM in JPDA debug mode:
Starting Apache Tomcat this way causes the script to generate a Java command line that includes the JPDA debugger startup argument, so if you are just taking the default JPDA server settings, you don’t need to type anything extra.
If instead, you need to specify a different debug server port number or other JPDA server settings, you will need to start Tomcat with “JPDA start” after setting one or more JPDA environment variables. For example, if you just want to change the port number, you can specify the new port number in the JPDA_ADDRESS environment variable, like this:
$ export JPDA_ADDRESS=8001
$ catalina.sh jpda start |
There are at least a few JPDA debug server environment variables that the catalina startup script knows how to use. Read the comment at the top of the catalina.sh script to see them and read their descriptions. Here is an excerpt:
#   JPDA_TRANSPORT  (Optional) JPDA transport used when the "jpda start"
#                   command is executed. The default is "dt_socket".
#
#   JPDA_ADDRESS    (Optional) Java runtime options used when the "jpda start"
#                   command is executed. The default is 8000.
#
#   JPDA_SUSPEND    (Optional) Java runtime options used when the "jpda start"
#                   command is executed. Specifies whether JVM should suspend
#                   execution immediately after startup. Default is "n".
#
#   JPDA_OPTS       (Optional) Java runtime options used when the "jpda start"
#                   command is executed. If used, JPDA_TRANSPORT, JPDA_ADDRESS,
#                   and JPDA_SUSPEND are ignored. Thus, all required jpda
#                   options MUST be specified. The default is:
#
#                   -agentlib:jdwp=transport=$JPDA_TRANSPORT,
# address=$JPDA_ADDRESS,server=y,suspend=$JPDA_SUSPEND |
Once your Tomcat has started up, you should be able to make a TCP connection to the port number you chose (8000 is the default). Try connecting to that port via a tool such as telnet to verify that it is working before proceeding to configure Eclipse.
Setting up a Remote Tomcat Debug Configuration in Eclipse
Now that Tomcat’s debug server is running, the next step is to configure Eclipse’s debug client to connect to the Tomcat JVM. Eclipse supports what they call “Run Configurations” and “Debug Configurations.” These are selectable configurations for running some code or debugging some code. We’ll create a new Debug Configuration and use it to connect Eclipse’s debugger to the external Tomcat JVM process. Follow these steps:
- In Eclipse’s menu, select Run > Debug Configurations…
- A new Debug Configurations window will appear
- In the list on the left, select Remote Java Application. Don’t worry too much about the word “remote” here. It just means that the JVM process can either be on the local machine or another machine across the network.
- Select New in the context menu (you can either right click to see the option for it, or select the icon above the list)
- A new Remote Java Application debug configuration window will appear
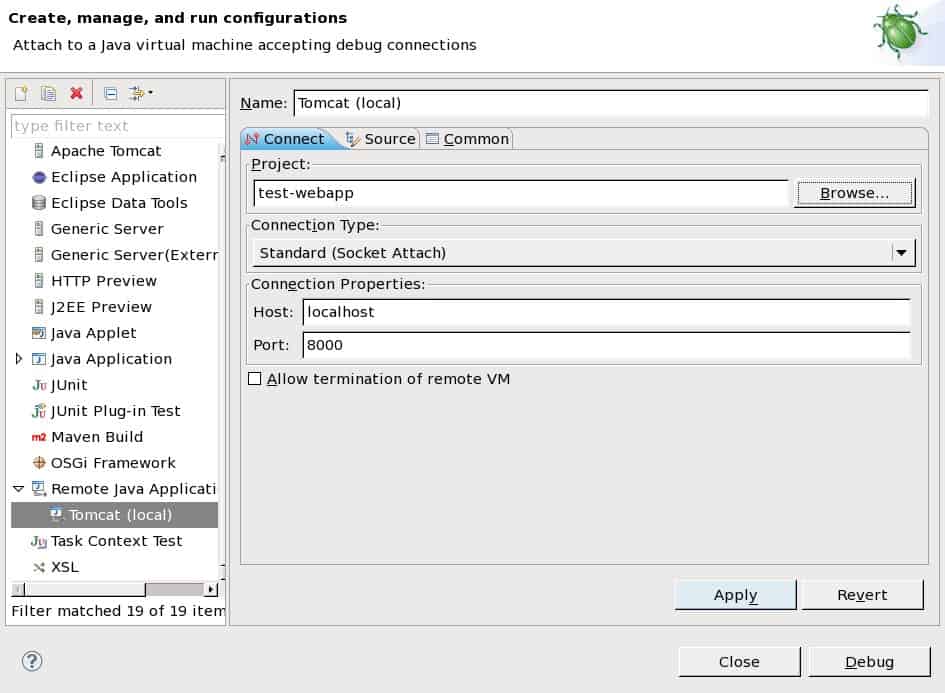
- Change the Name field to say “Tomcat (local)”, or the name of your web application, your choice. The name you put here can be anything, but shorter is better because the name will show up in menus.

There are at least three subtabs of configuration: Connect, Source, and Common. Under the Connect subtab, there is a Project field. Select the Eclipse project that represents the code you want to debug. For instance, if you want to debug your webapp, select your webapp’s Eclipse project here.
All of the other default settings should be fine. You should probably look through the settings to see if you would like to change any options, just beware of changing settings if you aren’t sure what the effect will be. Make sure that the port number you’re setting in the Connect subtab is the same port number you configured your Tomcat JVM’s debug server to listen on.
Click Apply, then click Debug. At that point, your Eclipse’s debugger will connect to your Tomcat JVM’s debug server. Next, switch to the Eclipse Debug perspective. In Eclipse’s menu, select Window > Open Perspective > Debug.
Debugging
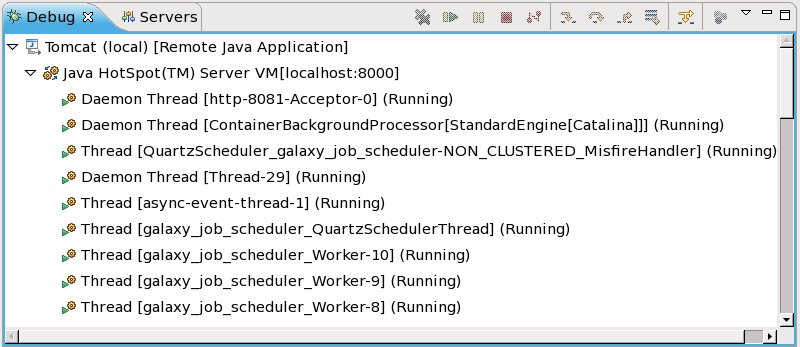
At this point, you should see the Tomcat JVM connected and a list of the JVM’s threads shown in the Debug view. From inside the Debug perspective, you can open your Java source files and any JSP files you would like to debug, and you can set breakpoints in these files, and single step through your code.

For example, open a Java source file that is part of your web application, where you know a method is run when you make an HTTP request. Move your editor cursor to a line of code inside the method that will run when you make the HTTP request, and set a breakpoint there by pressing Ctrl+Shift+B. You should see a small blue dot appear on that line of code in the far left margin of the editor view. Then, using your web browser, make the HTTP request that you know will run the method, and the debugger will automatically halt the Tomcat JVM on that line of code. In the debugger, you will notice that the JVM view now shows some controls for single stepping through the code, stepping into a method, stepping over a line of code, etc. Meanwhile, in the Variables view, you can inspect the active variables and their values. While you are debugging this way, your Eclipse debugger will suspend any thread in the JVM that attempts to run a line of code that has a breakpoint on it. Otherwise, threads behave the same as if you’re not debugging, with the exception of a small performance loss caused by having the debug server enabled and watching for breakpoints.
When you’re done debugging, you can either simply restart your Tomcat JVM without the “JPDA” option, or you can tell Eclipse’s debugger to disconnect.
If you’d like to debug Tomcat’s code in addition to your webapp’s code, you need to make Tomcat’s source code available to the Debug Configuration you are using, and then you can open one or more of Tomcat’s source files in the debugger and set breakpoints in those as well. Just make sure that the version of the Tomcat source you use matches the exact version of the Tomcat binary you are running.. otherwise, line numbers do not match up between the debug client and server, and the Eclipse display will show you on the wrong line of source code when you’re stepping through the code.
Using this procedure, you can debug any Tomcat instance including Tomcat 7, running any of your web applications. Try it, and let me know what you think.
