Introducing Auto-Paging for Anypoint Connectors

Reading Time: 9 minutes

Back in the old days when I used to write SaaS integration apps for living (long time ago, like 2 months back…) I always found it somehow difficult to reconcile large datasets with the Anypoint Cloud Connectors. Don’t get me wrong, I love those connectors! They solve a lot of issues for me, from actually dealing with the API to handle security and reconnection. However, there’re use cases in which you want to retrieve large amounts of data from a Cloud Connectors (let’s say retrieve my 600K Salesforce contacts and put them in a CSV file). You just can’t pass that amount of information in one single API call, not to even mention that you’ll most likely won’t even be able to hold all of those contacts in memory. All of these puts you in a situation in which you will need to get the information in pages.

So, is this doable with Anypoint Connectors? Totally. But your experience around that would be a little clouded because:

  • Each connector handles paging its own way (the API’s way)
  • It requires the user to know and understand the underlying API’s paging mechanism
  • Because Mule semantics follow the Enterprise Integration Patterns, there’s no easy way to write a block like “do this while more pages are available”

Solving the problem

So we sat down to discuss this problem and came to the conclusion that we needed to achieve:

  • Usage Consistency: I don’t care how the API does pagination. I want to paginate always the same way, no matter the connector
  •  Seamless Integration: I want to use DataMapper, ForEach, Aggregator, Collection Splitter, etc. without regards of the connector’s pagination
  • Automation: I want the pagination to happen behind the scenes… Streaming FTW!
  • size(): I want to be able to know the total amount of results even if all pages haven’t been retrieved yet
  • When do we want it?: In the October 2013 release!

 Two Stories, One Story

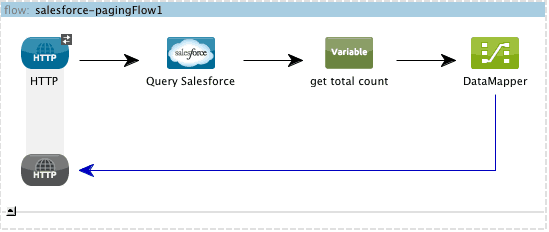
Consider an application that takes your Salesforce Contacts and transform them to CSV. As we said earlier, this is easy if you have an amount of contacts that would fit into memory and into the limits of the underlying API (salesforce doesn’t return more than 1000 objects per query operation). However, since the Salesforce Connector now supports auto-paging, the flow looks as simple as this no matter how large the dataset:

Wait a minute? I don’t see the paging complexity in that flow! EXACTLY! The connector handled it for you! Let’s take a closer look at the query operation:

As you can see there’s a new section now called paging with a Fetch Size parameter. This means that the operation supports auto paging and that it will bring your information in pages of 1000 items. So, you make the Query and use DataMapper to transform it into a CSV. It doesn’t matter if you have 10 million Salesforce Contacts, the auto paged connector will pass them one by one to DataMapper so that it can transform it. Because the whole process is using streaming behind scenes, you don’t have to worry about how Salesforce’s pagination API looks like nor about running out of memory.

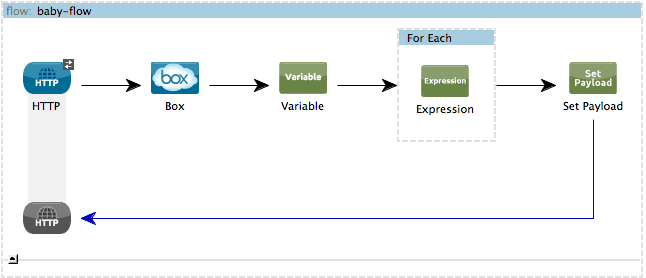
Now let’s take a look at this other app. This one uses the Box connector to get into a Box folder that has AN ENORMOUS amount of pictures. Suppose that it has all the pics I ever took from my daughter ever (I had to bought an external Hard Drive just for that).  So I want to get a list of all those files and make a list of them, but this time instead of DataMapper we’ll use ForEach and and expression component, just because I feel like it. This time the app looks like this:

If you compare this flow to the one before you’ll notice that they’re as different as they can be:

  • One uses DataMapper the other one uses a ForEach
  • One uses OAuth the other one connection management
  • Salesforce does paging using server side cursors
  • Box does paging with a limit/offset

However, the paging experience is exactly the same:

So in summary, although Box’s and Salesforce’s paging mechanisms are as different as they get, you can just use the connectors and write your flows without actually caring about the size of the data sets and the mechanics involved, while always maintaining the same development experience.

What’s that variable?

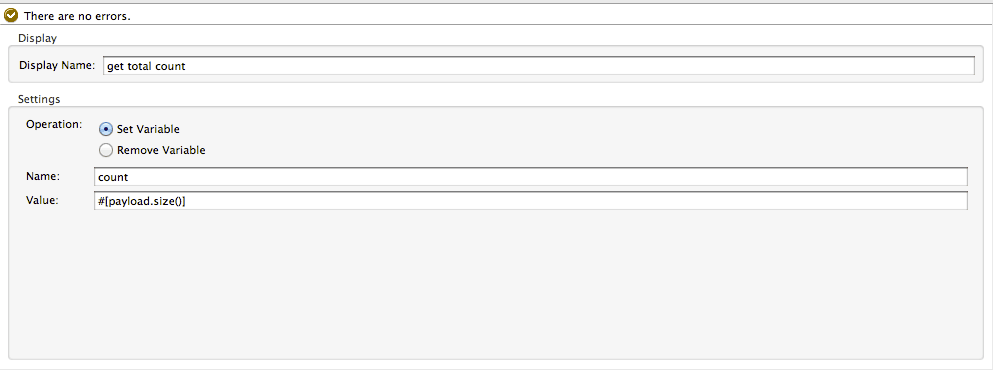
You probably noticed that in both examples there’s a variable processor just after the query processor. In case you’re wondering, that variable is completely useless. You don’t need to have it. Why is it in the example then? Just because I wanted to show you that you can get the total size of the dataset even if you still haven’t started to consume all the pages:

Where can I use it?

Next to Mule October 2013 release, new versions of these connectors were released now supporting auto paging:

Remember you can install any of them from Mule Studio’s connectors update site.

Can you share use cases in which this feature would make your life easier? Please share with us so that we can keep improving. Any feedback is welcome!

Chasing the bottleneck: True story about fighting thread contention in your code

Reading Time: 15 minutes

Today I’m going to share some valuables lessons learned about developing highly concurrent software. These are real life lessons that come straight from the development of the Mule ESB. This is a story about deadlocks, context switches, CPU usage and profiling, focusing in how to diagnose this issues which is often the hardest part of the solution.

So the story begins a couple of weeks ago when I started working on a new feature for Mule 3.5.0. You’ll hear the details about it soon enough but basically it’s a new feature that aims to address integration use cases which requires processing huge amount of data. As you can imagine then, this feature has to deal with parallelization, process management, atomicity, consistency, distributed locks, etc…. All the fun stuff!

Initial symptoms

So after 2 iterations of development I had my first alpha version which I proudly handed over my friendly QA co-worker (Luciano Gandini you’re the man!). He coded a couple of sample apps and started testing. Of course he came back with a list full of bugs, but one of them was about a performance bottleneck that in some cases turned into a deadlock. The issue also had this image attached:

Diagnose

Solving these kind of problems is pretty much like being a veterinarian. Your patient cannot tell you where it hurts or how it feels. All I had at the moment was a worried farmer saying “my Mule is walking slowly and doesn’t have much appetite”, which makes images like the one above extremely valuable… That is of course, as long as we’re able to interpret it. That’s the hard part!

So, what’s does the image above tell us? The image is a screenshot from a  software called VisualVM, which is a profiling application that monitors a JVM instance and gives you useful insights about memory, CPU usage, and the active threads and their state. Here we can see:

  • The threads that are showing belong to a thread pool that my new feature creates. The tool showed a lot of other threads but for illustrative purposes I’m just showing these ones.
  • Next to each thread name there’s a timeline that shows each thread’s state through a period of time
  • When the thread is green, then it means it was processing.
  • When it’s yellow, it means that the wait() method was called on it and it’s waiting for a notify() or notifyAll() invokation to wake it up
  • Finally, red means that the thread is waiting to gain access over a monitor (which in simpler words means that it has reached a synchronized block or is waiting for some kind of lock)

So at this point we can already have our first conclusions:

  • All threads seem to be getting red at the same time, which much likely means that they’re all trying to access the same synchronized block at the same time. Also, they’re red most of the time which explains why work is being done slowly.
  • Also, there’re some threads that spend quite some time being yellow, aka waiting for something else to happen. Because there’re so many threads blocked, it’s hard to deduce why that’s happening at this point, so for now we’ll only focus on the red threads.

Allright! So now we know what’s happening which is a lot! However, we still don’t know why it’s happening… Meaning, we don’t know which pieces of code are causing this. That’s what a thread dump is useful for. Basically, a thread dump gives you the current stack trace for each of these threads at a given time so that you can see what they were actually doing. The dump showed this:

  • waiting to lock <7e69a3f18> (a org.mule.module.batch.engine.RecordBuffer$BufferHolder)
    at org.mule.module.batch.engine.RecordBuffer$BufferHolder.access$3(RecordBuffer.java:128)
    at org.mule.module.batch.engine.RecordBuffer.add(RecordBuffer.java:88)
    at org.mule.module.batch.BatchStepAggregate.add(BatchStepAggregate.java:101)
    at org.mule.module.batch.DefaultBatchStep.onRecord(DefaultBatchStep.java:144)
    at org.mule.module.batch.BatchRecordWork.run(BatchRecordWork.java:62)
    at org.mule.work.WorkerContext.run(WorkerContext.java:294)
    at java.util.concurrent.ThreadPoolExecutor$Worker.runTask(ThreadPoolExecutor.java:895)
    at java.util.concurrent.ThreadPoolExecutor$Worker.run(ThreadPoolExecutor.java:921)
    at java.lang.Thread.run(Thread.java:680)

So that’s it! Threads are getting locked at line 88 of the RecordBuffer class. Congratulations: You just found your tumor!

Treatment

Luckily, this tumor was operable so with a little refactoring I was able to avoid any contention and remove the deadlock. But as you know, no surgical procedure is without an aftermatch, so before declaring the bug as fixed I did the test again and ran a profiling of my own. This time I used another profiler called Yourkit instead of VisualVM, mainly to take advantage of its usability features.

NOTE: I chose YourKit because I like its usability features and because Mulesoft has purchased licenses for it, so it came handy to do so. However, I do want to emphasise that other products such as JProfiler or Mission Control could have got the job done just as well. Just choose the one you like the most!

After repeating the test, I got this second image:

So red is mostly gone…. The ones you still see are because of network I/O and have reasonable length. However, what’s all the deal with all the yellow? Now most of my threads went from being blocked to being waiting. That’s not cool either! Deadlock are gone so the app would not hang anymore but performance hasn’t gone up, it’s just as slow as it was before. Additionally at this point I noticed a new symptom I hadn’t seen before: CPU usage was really low. Like under 20% percent.

What do we do now? The same as before, getting a thread dump on the waiting threads. The results were more surprising! Remember that I told you that these threads were part of a thread pool that my new feature creates? Well, it turns out that the threads were actually idle, just sitting there waiting for more work to come. I went through the code many times asking myself “how in hell is this possible?”… The answer was quite simple: while fighting the high complexity of the code, I lost sight of the simplicity of the configuration

In short, I have a thread pool to do processing. We’ll call the threads in that pool “worker threads”.  Plus, there’s another thread which has the responsibility of dispatching work to that pool (we’ll call it dispatcher thread). The dispatcher thread was able to generate work way faster than the worker threads were able to finish it. As a result, the pool gets exhausted pretty quickly. Thread pools often have configurable strategies to deal with exhaustion… Some strategies reject the excess of work, some wait… Turns out that the default configuration of the thread pool I was using was to execute the job in the invoking thread. That means, that the dispatcher thread could not keep dispatching work because it was busy processing the work that it was supposed to give to others. So, by the time the worker threads were ready to take more work in, they had to wait for the dispatcher thread to be available again.

As simple as this bug is, actually seeing it can be quite tricky. How did I discover this? By looking at the thread dump for the dispatcher thread. Once again, profilers are your friend.

Solution was easy: I just configured the thread pool to wait in case of exhaustion. In that way, as soon as a worker thread becomes available, the dispatcher thread wakes up and gives work to it. The profiler now looked like this:

Now we see that the worker threads are making efficient use of the CPU and there’re no red dots other than the inevitable I/O. CPU usage was now around 100% per cent and the app was 58% faster.

Less concurrency is more

One last thing: When I was checking CPU usage I noticed  that although usage was around 100%, more than half was being used in “system operations” and only around 45% was actually being used by mule. This happened because the thread pool was way bigger than necessary. Parallelism is good, but you can never lose sight of the fact that the more threads you have, more overhead in context switches you’ll suffer. So, I took my thread pool down from 100 threads to only 16. The result? My test was now one minute faster. So remember: when you’re tuning for maximum CPU usage,  don’t go for as many threads as you can allocate. Instead, search for the number that will give you maximum CPU usage with the lower context switch overhead.

Summary take-aways

I hope you find this useful. This is how we make our Mule gallop!

The key things you should remember from this post are:

  • When testing performance, use a profiler to make sure you’re making efficient use of your resources
  • Try to keep synchronized blocks to a minimum
  • Try to reduce wait times
  • Do not abuse your ability to start threads. Reduce the context switch overhead
  • But most importantly: It doesn’t matter how much data you have if you’re not able to interpret it  and turn it into information

Thank you for reading. See you next post around!

Decorating your tests in AngularJS

Reading Time: 4 minutes


Introduction

We’ve been using AngularJS at MuleSoft for building our upcoming web-based developer tools and so far we have really enjoyed using it. One area that’s really important to us as developers is unit testing our JavaScript code.This ensures we deliver high quality code that is easy to maintain and refactor and allows us to ship features quickly with confidence

Decorators in Angular are really useful for unit testing your Angular JavaScript code. This post is an example of how you can use them to to use them to create great unit tests.

First, we will start by defining two factories, one called greeter and the other called worldGreeter. What we want to achieve here is writing unit tests for the worldGreeter factory instance.

Let’s start with a module named myApp that contains both factories:

As you can see, worldGreeter is simply concatenating the input from greeter. So, when injecting worldGreeter the result will be the string HelloWorld.


Testing 1,2,3

The testing frameworks we will be using are mocha as runner and chai for assertions. So let’s write the test:

We will replace greeter with our own implementation. The additional injected parameter named $delegate is a reference to the old greeter instance. It is really helpful if you plan to use them with a mocking or stubbing framework like sinon.

Next, we are going to use another angular trick. We name the instance to be injected _worldGreetereter_ so we can have a worldGreeter instance on the describe scope. inject recognizes this and injects the proper instance allowing the usage of the more handy worldGreeter variable.

Finally, we write an assertion to verify that greeter was replaced successfully:

The bottom line

To sum up, great things can be achieved by using decorator in tests as it is really useful when having to replace instance dependencies. Last but not least, you can see the code working in this jsfiddle.

Synchronizing Mule Applications Across Data Centers with Apache Cassandra

Reading Time: 7 minutes

Mule Clustering is the easiest way to transparently synchronize state across Mule applications in a single data center. Mule Clustering, however, assumes that the Mule nodes are “close” to each other , typically on the same network, in terms of network topology.   This allows Mule applications to be developed independently from the underlying cluster technology and not to explicitly account for scenarios like network latency or cluster partitioning.

These assumptions aren’t as sound when dealing with multi data center deployments.  Unless you’re lucky enough to have fast and reliable interconnects between your DC’s you need to start accounting for latency between datacenters, the remote data center going offline, etc.  In such situations the choice of a data synchronization mechanism becomes paramount.

The Cassandra Object Store

Mule’s state storage and synchronization features are implemented via object-stores.  object-stores provide a generic mechanism to store data.  Message processors like the idempotent-message-filter and until-successful router use object-stores under the covers to maintain their state. Typically object stores are transparent to the Mule application and Mule will pick the appropriate default object store based on the environment the application is running in.

When considering how to synchronize state across data centers with Mule applications, however, you should consider using an object-store implementation that can handle network latency and partitioning.  Version 1.1 of the Mule Cassandra Module introduces preliminary support for such an object-store.

Configuring the CassandraDBObjectStore

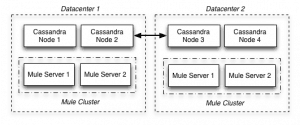
Apache Cassandra is a column-based, distributed database that is architected for multi data center deployments.  The Cassandra Module’s “CassandraDBObjectStore” lets you use Cassandra to replicate object store state across data centers.  Let’s consider the following topology for an imaginary Mule application that needs to distribute the state of an idempotent-message-filter across DC’s:

In this topology we have 2 independent Mule Clusters in each data center.  We also have  Cassandra deployed across data centers in a cluster.  Our Mule application will use the default Object Store for all use cases except for the flow we want to apply the idempotent-message-filter on.  For this case we’ll use the object-store provided by the Cassandra Module.  Let’s see how this looks.

We start off by wiring up the Spring Bean to define the CassandraDBObjectStoreReference.  In this case we set the host to cassandrab.acmesoft.com, the address of a loadbalancer that will round-robin requests to each Cassandra node local to the Mule Cluster’s datacenter.  We’ve dedicated a keyspace for this application and called it “MuleState”.  Since we want to ensure the same message can’t be processed in either data center we’ve set the consistencyLevel of the Object Store to “ALL”.  This will ensure the row is written to all replicas.

The CassandraDBObjectStore is “paritionable” meaning that it can split the object storage up intelligently.   In this case we’re setting the partition name to be dynamic using a MEL expression to evaluate the current date (the implementation currently creates a ColumnFamily for each partition.)

The flow accepts HTTP payloads on the given addresses and uses the message’s payload as the mechanism for idempotency.   If the message isn’t stored in the ColumnFamily corresponding to the partition then the message is passed to the VM queue for further processing, otherwise its blocked.  The ALL consistency level will ensure this state is synchronized across clusters in each data center.

Wrapping Up

Cassandra’s support for the storage of native byte arrays and its multi-data center aware design make it a good choice as an object-store implementation.  Its support for multiple consistency levels is also very useful, allowing you to relax the synchronization requirements depending on your use case.  You could, for instance, set the consistencyLevel of the object-store to “LOCAL_QUORUM” to ensure state is synchronized in only the local data center, which replication to the other DC potentially happening later, as a trade off for increased performance.

Other potential good fits for the Cassandra Module’s object-store are for the until-successful and request-response message processors, both of which require shared state.