After thousands of MuleSoft Support cases, you start to see the same problems come back, and this is one of the most persistent. Picture a Mule app that has run cleanly for months: traffic climbs, and it starts to stall — no code change, no new flow, just more load. Dig in, and a common culprit turns up: the app forwards its logs to a third-party log aggregator through Log4j2’s generic HttpAppender, whichever vendor sits on the other end. On a laptop you never notice it; on a small CloudHub worker under load, logging starts competing with the requests the app exists to serve.
What makes it expensive is not any single incident but the sheer recurrence: it drives escalations, burns support and engineering hours, and erodes a customer’s trust in an app that was never truly broken — which is why it is worth solving once, properly, rather than one case at a time. This article explains why it happens and shows one way to fix it.
Logging and application performance
Ask a developer what slows an app down under load, and logging rarely comes up — it feels like a background chore, a line written and forgotten. On a console or a local file that instinct is fair, because the write costs microseconds. Send that same line over the network to a log aggregator, though, and the economics change completely, which is why the logging path deserves far more attention than it usually gets. Forwarding logs over HTTP is convenient, but sending them one request at a time is where the cost hides. The Log4j2 HttpAppender manual warns that sending logs synchronously, one by one, to an HTTP backend is rarely a good idea. Each log call can block for tens or hundreds of milliseconds — orders of magnitude more than a console or file appender — and every network or backend hiccup then lands directly on your loggers. Its own advice is to use asynchronous loggers at minimum (which Mule 4 apps already use by default) or to look at a third-party appender instead.
Some vendors ship their own tuned appenders that, in a nutshell, send events in batches, and in MuleSoft Support we recommend them where they exist. But not every vendor offers one. The recommended log appenders KB lists dedicated appenders for Splunk, New Relic, and Sumo Logic, yet for some vendors it can only point you to the vendor’s own support. What is more, a vendor may deprecate or stop maintaining its Java logging library. Whichever appender ends up shipping your logs, though, it leans on the same Log4j2 machinery underneath — and that machinery may hold up far less well under load than most developers expect.
Why asynchronous logging turns synchronous under load
Asynchronous logging is what normally keeps logging cheap. In Log4j2 it runs through a ring buffer: your app hands each event to a fixed-size buffer and goes straight back to serving the request, while a single background thread works through the buffer and does the slower part, the actual send, off to one side. The network wait never lands on the threads doing your real work, so logging feels almost free. Figure 1 traces that path, and what happens when the background thread can’t keep up.
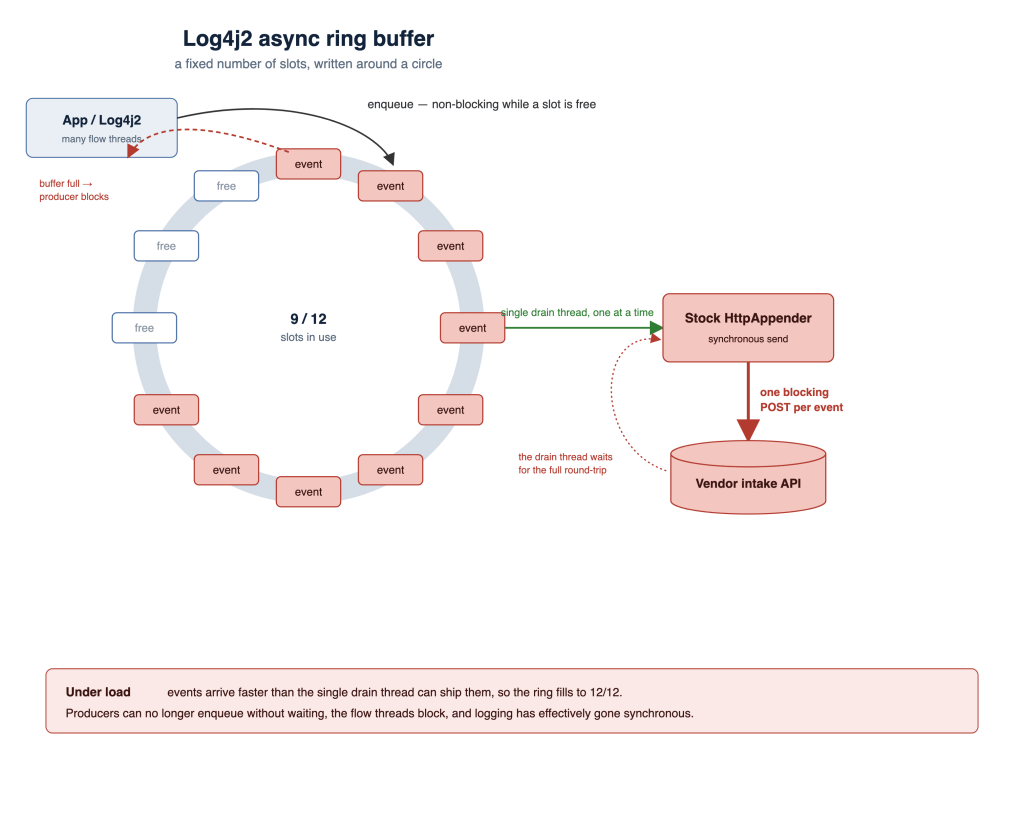
Figure 1. Log4j2’s async ring buffer under load — blocked-thread state drawn out. A single background thread drains the buffer and hands one event at a time to the stock HTTP appender, which makes one blocking POST per event and waits for the full round-trip; once events arrive faster than they drain, the buffer backs up and the app’s own threads block. The batching fix appears in Figure 2. Alt text (for publishing): a circular ring-buffer diagram with twelve slots (nine holding events, three free), an App/Log4j2 producer enqueueing into the ring, a single green drain-thread arrow to the stock HttpAppender, a red one-blocking-POST-per-event arrow to the vendor intake API with a dotted round-trip-wait return, and a red back-edge showing producers blocking once the buffer is full. Source: original diagram by the author.
This only works while the background thread keeps up — and what decides that is how fast the appender drains the buffer, not the buffer itself, and not disk versus network. A file appender drains in microseconds, so it almost always keeps pace; a network appender that ships events in batches keeps pace too, clearing many slots per request. The one that falls behind is both slow and serial: a network appender that sends one event at a time over HTTP and waits for each round-trip, tens or hundreds of milliseconds apiece. At low volume even that is fine, because the background thread clears one event before the next arrives.
Push the log volume higher, though, and events start arriving faster than they can be sent. The buffer fills, your app’s threads have nowhere to hand off, and they end up waiting — logging has quietly become synchronous. Every log line now waits on its own blocking POST to the vendor’s intake, on the very threads serving your customers — the exact outcome asynchronous logging exists to prevent.
When no tuned appender exists, you fall back to the stock HTTP appender and inherit its synchronous, one-request-per-event behavior.
The current state: one request per event
That inherited behavior is easy to miss. It costs you nothing at low volume, and only surfaces under sustained load — the busier your app gets, the more logging work piles back onto the threads serving your customers. We see the fallout regularly in MuleSoft Support, and the underlying mechanism is documented in the KB on performance degradation from logging.
The symptom shows up plainly in a thread dump. Because the stock HTTP appender sends one blocking POST per event, it falls behind under load, and an application thread ends up blocked in the logging path, waiting for room to hand off its next event:
"[http-log4j2-appender].http.requester.hello_appender_HTTP_Request_configuration.01 SelectorRunner" #114 prio=5 os_prio=0 cpu=3038.15ms elapsed=721.07s tid=0x00007fc9901039b0 nid=0x38f waiting for monitor entry  [0x00007fc8db9f5000]
   java.lang.Thread.State: BLOCKED (on object monitor)
    at org.apache.logging.log4j.core.async.AsyncLoggerConfigDisruptor.enqueue(org.apache.logging.log4j.core@2.20.0/AsyncLoggerConfigDisruptor.java:365)
    - waiting to lock <0x0000000702732d88> (a java.lang.Object)
    at org.apache.logging.log4j.core.async.AsyncLoggerConfigDisruptor.enqueueEvent(org.apache.logging.log4j.core@2.20.0/AsyncLoggerConfigDisruptor.java:320)
    at org.apache.logging.log4j.core.async.AsyncLoggerConfig.logInBackgroundThread(org.apache.logging.log4j.core@2.20.0/AsyncLoggerConfig.java:181)
    at org.apache.logging.log4j.core.async.EventRoute$1.logMessage(org.apache.logging.log4j.core@2.20.0/EventRoute.java:46)
    at org.apache.logging.log4j.core.async.AsyncLoggerConfig.handleQueueFull(org.apache.logging.log4j.core@2.20.0/AsyncLoggerConfig.java:171)
    at org.apache.logging.log4j.core.async.AsyncLoggerConfig.logToAsyncDelegate(org.apache.logging.log4j.core@2.20.0/AsyncLoggerConfig.java:158)
    at org.apache.logging.log4j.core.async.AsyncLoggerConfig.log(org.apache.logging.log4j.core@2.20.0/AsyncLoggerConfig.java:138)
That blocked thread is what one request per event looks like in production — a single synchronous POST per log line, sitting on the path of every request — and clearing that bottleneck is exactly what a batching HTTP appender is built to do.
A batching HTTP log appender
The Batch HTTP log appender is a replacement for the stock HTTP appender, built for exactly this bottleneck: it takes log delivery off your application threads and turns thousands of tiny synchronous POSTs into a handful of large, compressed requests.
That handoff is simple: each event is enqueued into a bounded in-memory queue and the flow thread returns immediately, so the network round-trip never lands on the path serving your customers. A background worker thread then coalesces those events and ships each batch as a single gzip-compressed request.
When each batch ships is governed by three flush triggers, whichever fires first — a record count (maxBatchRecords), a payload size (maxBatchBytes), or the age of the oldest queued event (lingerMillis) — so the same appender tunes from high-throughput bulk delivery to low-latency, near-real-time shipping without a line of application code. The same events reach the same backend; you simply stop paying the per-event request cost thousands of times over.
Figure 2 shows the pattern end to end, including the failure path — because taking delivery off your threads only pays off if those logs still arrive when the endpoint can’t take them right away. How the appender holds onto them instead of losing them is the resilience story the rest of this section tells.
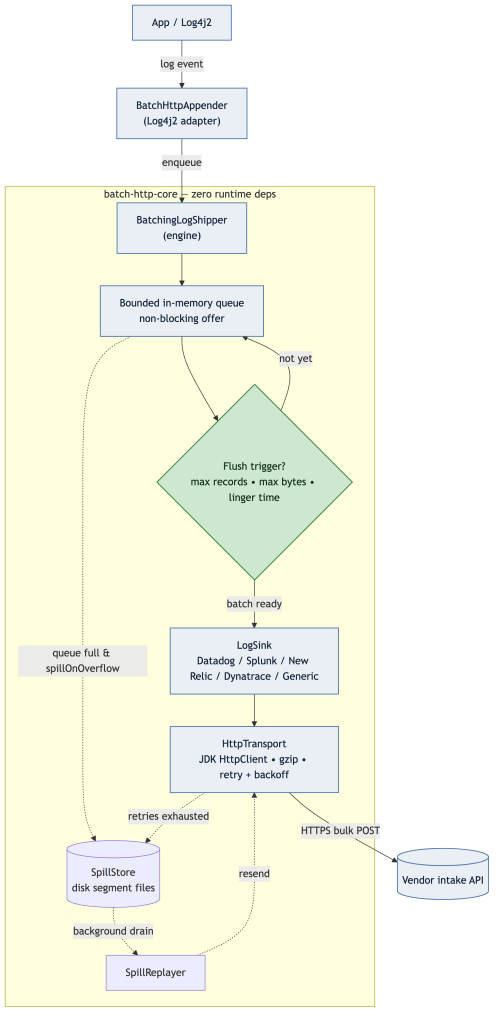
Figure 2. Batching HTTP appender architecture — the batching fix for the stock path in Figure 1. Alt text (for publishing): flowchart showing log events enqueued to a bounded in-memory queue, batched by flush triggers, shipped over HTTPS to a vendor intake, with a disk-spill store (on by default) and background replayer on the failure path. Source: the architecture diagram in the batch-http-log-appender repository README.
Production log delivery also has to survive a throttling intake, a flaky network, and a worker restart, so resilience is built in rather than bolted on:
- Server-aware retries. Transient failures — 408, 429, 5xx, and network errors — are retried with jittered exponential backoff (from 200 ms up to a 10 s ceiling). When a throttled intake returns a Retry-After header, the appender honors it (capped at the same 10 s ceiling), backing off in step with the backend instead of hammering it.
- Fail-fast on permanent errors. A bad API key or wrong endpoint is surfaced immediately rather than retried forever, and an oversized event is capped before it can bloat the queue.
- A crash-resilient disk-spill buffer, on by default. When the endpoint is unreachable or the in-memory queue overflows, events are persisted to rotating segment files and a background replayer re-ships them once delivery recovers — at-least-once, so a transient outage can cost you the occasional duplicate rather than lost logs.
How to set up the Batch HTTP appender in a Mule 4 app
Adopting the Batch HTTP appender takes three small changes: add the batch-http-log4j2 dependency to your app’s pom.xml (build it once with mvn install, as the repository README describes); add packages=”com.mulesoft.support.batchhttp.log4j2″ to the <Configuration> element of your log4j2.xml, because without it Log4j2 silently ignores the appender and no logs ship; and swap the stock <Http> appender for <BatchHttp>. The custom log appender documentation covers how Log4j2 config loads on the platform. Pair the appender with async loggers, and your whole app ships logs without blocking a flow.
Here is an example configuration for Datadog (set site to the log-intake host of your Datadog site):
<BatchHttp name="datadog" vendor="datadog"
           site="http-intake.logs.datadoghq.com"
           apiKey="${sys:datadog.apiKey:-${env:DD_API_KEY:-MISSING_KEY}}" service="orders-api" source="mule"
           maxBatchRecords="200" lingerMillis="1000" gzip="true">
    <PatternLayout pattern="%m"/>
</BatchHttp>
Refer to the batch-http-log-appender repository for the full per-vendor snippets and the complete list of configuration options.
The appender uses no vendor SDKs and, beyond Log4j2 itself, has no third-party runtime dependencies: one library, built on the JDK’s own HTTP client.
Supported vendors
The Batch HTTP appender is built to support almost any vendor: as long as there is a publicly documented HTTP log-intake endpoint, that vendor can be added to the appender.
Vendor support implemented so far (Datadog and New Relic are the two benchmarked below):
- Datadog
- Splunk HEC
- New Relic
- Dynatrace
A generic configuration is also available for forwarding logs to any other service that accepts newline-delimited JSON (NDJSON) or a JSON array. Vendor support is still a work-in-progress, so expect some rough edges.
Key configuration attributes
The batching knobs are all optional and have sensible defaults, so the appender works out of the box. The most useful ones are:
- The flush triggers, whichever fires first: maxBatchRecords (default 200), maxBatchBytes (1 MiB), and lingerMillis (1000 ms).
- queueCapacity (10000) for the bounded in-memory queue.
- gzip (on by default).
- maxRetries (3, i.e. up to four attempts; backoff and Retry-After handling as described above).
- spillEnabled (on) for the crash-resilient disk-spill safety net.
The complete attribute reference and defaults live in the batch-http-log-appender repository, alongside the runnable demo apps you can deploy yourself. Sensible defaults are one thing; what batching actually buys you under sustained load is another, so we measured it. The benchmarks below put the Batch HTTP appender head-to-head with the stock HTTP appender under a real load test.
Benchmarks
To show what batching actually buys you, we load-tested the same Mule 4 app with the stock and the Batch HTTP appender side by side on CloudHub 1.0 and CloudHub 2.0, and looked at two things: how much throughput the app gets back, and how quickly its logs reach the log aggregator. Here is how the lab was set up and what we held constant across every run.
Test lab setup
We deployed four builds of the same hello-world Mule 4 app (the stock and the Batch HTTP appender, each paired with Datadog and with New Relic) on 0.1 vCore workers on CloudHub 1.0 and CloudHub 2.0, and drove them with oha through four tests:
- Test 1 (1 min)
- Test 2 (a 1-min repeat without a restart, the “churn” run)
- Test 3 (5 min)
- Test 4 (5 min with a 30 s per-request timeout)
Every worker was restarted and warmed up before each run (except before Test 2), no vendor intake was ever loaded by two apps at once, and gzip and the disk-spill buffer were switched off so the Batch HTTP appender was measured on the same footing as the stock one. The full method, per-test tables, and a runbook to reproduce every run are in the repository’s benchmark results and benchmark runbook.
What the benchmarks show
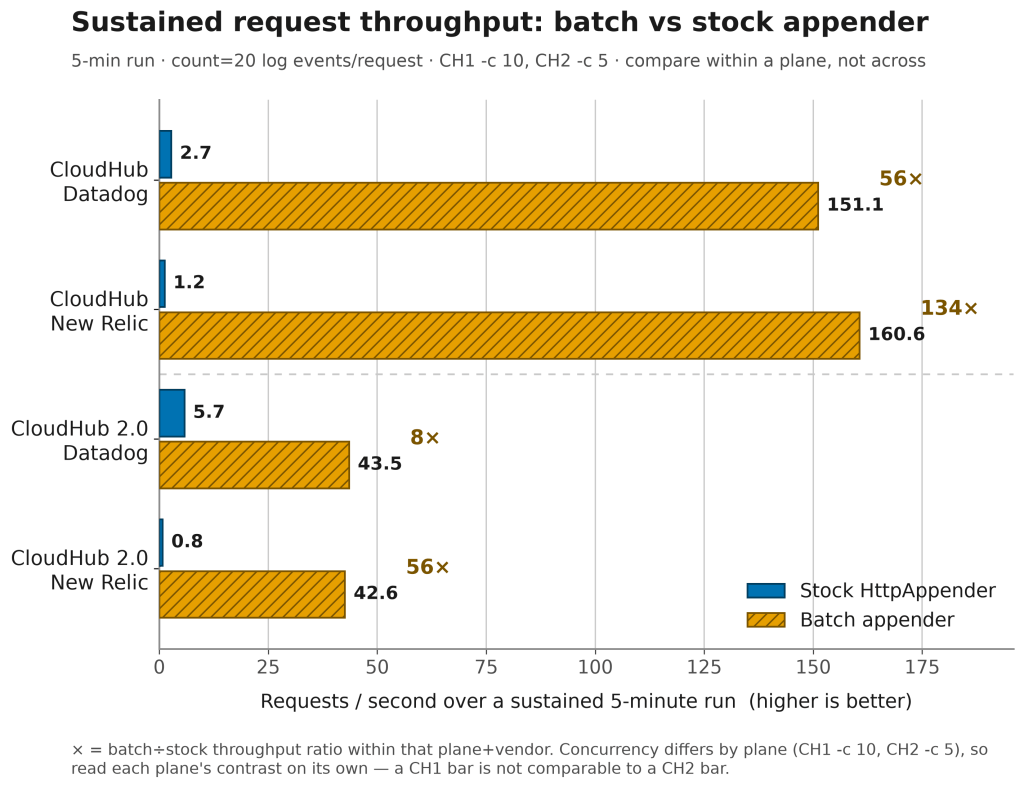
Figure 3. Sustained request throughput (Test 3, five-minute warm window): batch versus stock req/s, by platform and vendor. Compare within a platform, not across — the two planes ran at different concurrency on different CPU. Alt text (for publishing): grouped horizontal bar chart of requests per second, with batch bars many times longer than their stock counterparts on both CloudHub 1.0 and CloudHub 2.0. Source: docs/benchmark-results.md in the batch-http-log-appender repository.
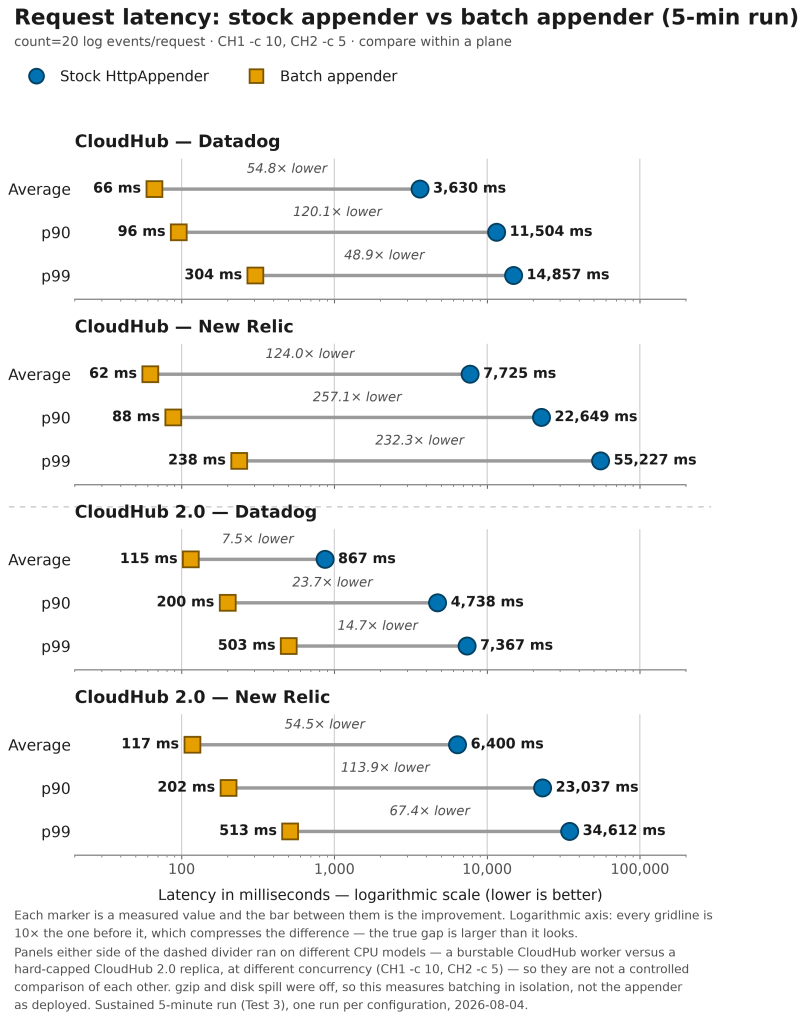
Figure 4. Request latency (Test 3) — mean, p90, and p99 on a log axis, drawn as a range plot: each pair’s stock and batch markers joined by the improvement gap. Because the load is closed-loop, lower mean latency and higher throughput are the same effect seen two ways. Alt text (for publishing): dumbbell chart with stock latency markers far to the right of the batch markers, the joining line labeled with the N-times-lower gap for each metric. Source: docs/benchmark-results.md in the batch-http-log-appender repository.
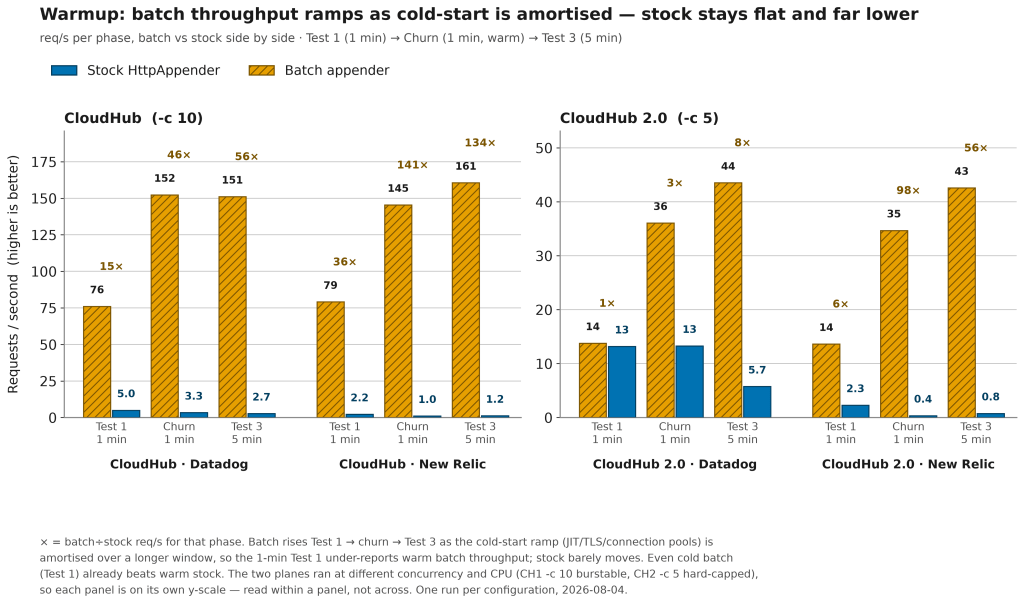
Figure 5. Warmup / cold-start effect: batch and stock req/s side by side across Test 1 (1 min) → Test 2 (churn) → Test 3 (5 min). Batch throughput ramps as the fixed cold-start cost is amortized over a longer window, while stock stays flat or drops, and far lower — which is why the one-minute Test 1 under-reports warm batch throughput. Alt text (for publishing): two grouped bar panels, one per platform; the batch bars rise left to right across the three phases while the stock bars barely move. Source: docs/benchmark-results.md in the batch-http-log-appender repository.
On the same 0.1 vCore workers, shipping to the same vendors, the Batch HTTP appender sustained roughly 56× (Datadog) and 134× (New Relic) the stock appender’s throughput on CloudHub 1.0, and roughly 8× and 56× on CloudHub 2.0 (Test 3, five minutes).
Ingest lag: when your dashboard falls behind
The figures below show the lag between two timestamps: when a Mule 4 app generated the log message, and when the log aggregator ingested it. The Batch HTTP appender shows little to no lag, while the stock HTTP appender shows a significant delay in logs being ingested. This is not a third-party vendor having performance issues — it is the stock appender still draining the application’s ring buffer. In an earlier Datadog session on CloudHub 2.0 with the same apps, the stock app was already trailing by about three minutes after only a few minutes of load. Under heavier, sustained production load we have observed delays of 10–15 minutes or more, with log messages still arriving at the log aggregator long after the load has stopped.
Note: on each figure, timestamps on the left are shown in local time (AEST, UTC+10) and on the right in UTC. Because only the time zone differs, compare the minutes and seconds rather than the hour to read the true ingest lag.
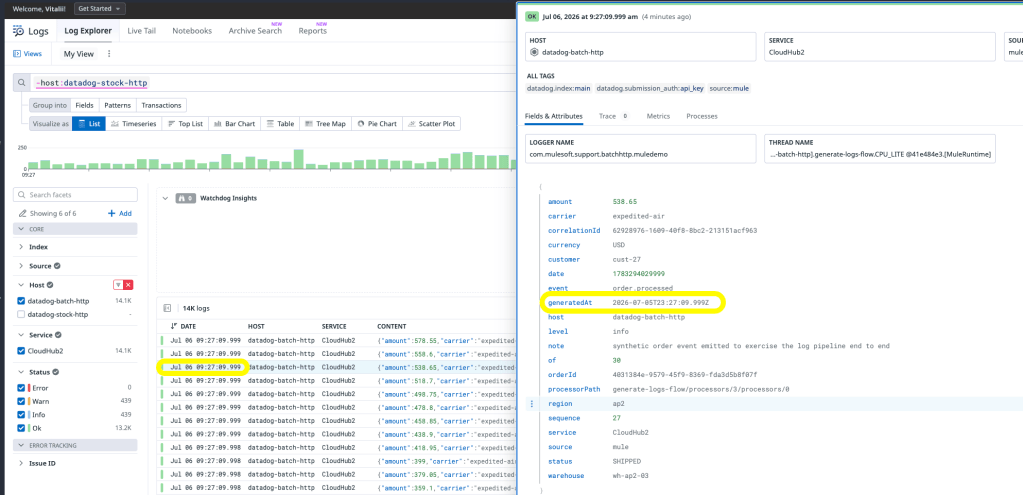
Figure 6. Batch-app ingest lag in Datadog — near zero lag; each event’s generatedAt stays aligned with its received time even under load. Alt text (for publishing): Datadog Log Explorer screenshot of the batch app’s logs, with one event expanded to show a highlighted generatedAt timestamp that matches its received time to the millisecond, beside a steady green histogram of log volume. Source: docs/img/datadog-batch-ingest-lag.png in the batch-http-log-appender repository.
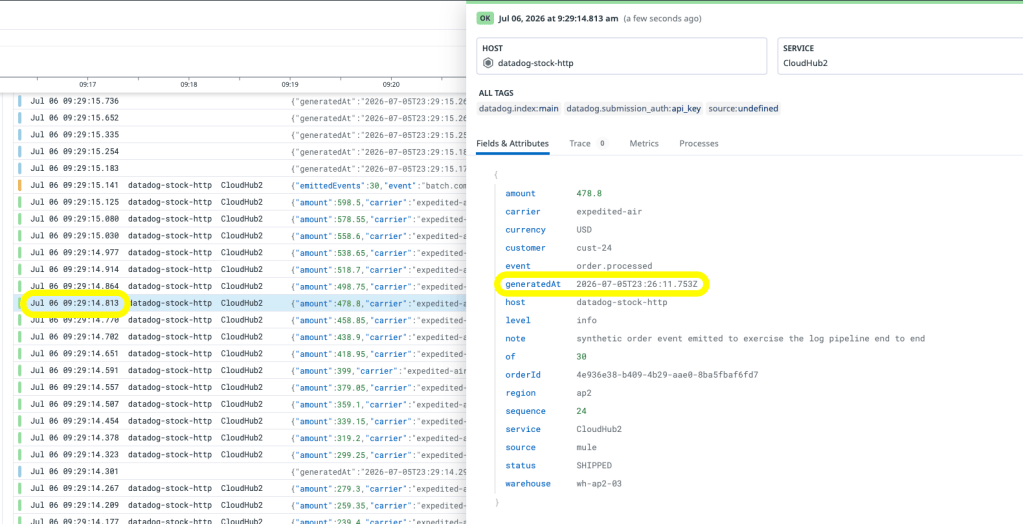
Figure 7. Stock-app ingest lag in Datadog — trailing by roughly three minutes as the synchronous appender falls behind and keeps draining its backlog after the load stops. Alt text (for publishing): the same Datadog Log Explorer view for the stock app, where the expanded event’s highlighted generatedAt timestamp is just over three minutes earlier than the time Datadog received it. Source: docs/img/datadog-stock-ingest-lag.png in the batch-http-log-appender repository.

Figure 8. Log volume delivered to Datadog over the same query window (both runs plus the stock app’s backlog drain) — about 84.7K events from the batch app versus about 5.66K from the stock app. Alt text (for publishing): a Datadog facet list showing the two host filters with their event counts side by side, datadog-batch-http at 84.7K and datadog-stock-http at 5.66K. Source: docs/img/datadog-log-volume-batch-vs-stock.png in the batch-http-log-appender repository.
Conclusion
Compared with the stock HTTP appender, the Batch HTTP appender changes how your logs are shipped — and the difference shows most under load:
- Higher throughput, same resources. The same app handles substantially more work (roughly 8–134× in our tests) on the same CPU and memory — you reclaim the throughput the synchronous appender was spending on thousands of tiny, blocking POSTs.
- No self-throttling when load spikes. With the stock appender, once log delivery falls behind, the flow threads block on each POST and the app quietly throttles itself — serving fewer requests exactly when traffic is highest. The Batch HTTP appender’s non-blocking enqueue removes that backpressure: a promotion or incident spike is absorbed by the in-memory queue and drained by a background worker, so your flows keep serving customers at full rate instead of stalling behind their own logs.
- Dashboards that keep up. Logs reach your aggregator in near real time instead of trailing minutes behind (about three in our lab test, and 10–15 or more under heavier production load), so what you see during an incident is what is actually happening.
- Logs survive outages. Server-aware retries and the crash-resilient disk-spill buffer carry your logs through endpoint outages and restarts — at-least-once, so the worst case is a duplicate, not a gap.
The takeaway is simple: logging should be a side effect, not a bottleneck. Take log delivery off the application thread, batch it over the network, and the same Mule 4 app does more work on the same resources — while your logs still arrive. The links below cover how to adopt it.
Try it yourself
The Batch HTTP log appender is open source under the Apache License 2.0. If this fits a problem you are facing, head to the GitHub repository, follow the setup steps, and swap the appender in your log4j2.xml — no application code changes and no vendor SDKs required.
Clone it, run the demo apps against your own vendor, and measure the difference on your own workload.
Found a bug, hit a rough edge, or have an idea to make it better? Open an issue on the repository. The project is published as-is, with no support commitment, but bug reports, questions and ideas are welcome there.
Further reading
Recommended log appenders for third-party aggregators — the MuleSoft KB behind this article.
Performance degradation caused by high volume of logging in Mule 4 — the ring buffer mechanism.
Batch HTTP log appender on GitHub — the open-source reference implementation. The repository’s docs cover installation, the full configuration and attribute reference, licensing, and where to raise issues.