
Enterprise AI agents are moving from experimentation to production. But scaling agents is not just about building more workflows, adding more tools, or integrating more systems. The real challenge is how do you measure whether your agents are effective, efficient, governed and safe at scale.
Agent orchestration is often described as a coordination layer for enterprise agents. But in mature organizations, orchestration becomes something more powerful, it becomes a measurable control plane and is the difference between experimentation and enterprise-grade AI. If you cannot measure your agents, you cannot scale them.
This paper provides a practical KPI framework, a ready reckoner for CIOs, CTOs, Enterprise Architects, and Platform Engineering stakeholders evaluating or deploying agentic systems.
Note: Not all KPIs discussed in this framework are natively exposed as out-of-the-box dashboards. See the footnote at the end of the writeup.
Why KPIs Matter for Agentic Systems
APIs and their governance and observability cannot be afterthoughts. The same logic applies to agents as well. Agents introduce a variety of activities and risks like, Non-deterministic behavior (LLMs), External knowledge retrieval (RAG), Autonomous execution, Multi agent collaboration, Dynamic tool invocation and Real time orchestration across systems. Without measurable guardrails, risk compounds silently.
The question is not about “Can we orchestrate agents?” but “Can we measure and control agents at scale?”
To answer that, we evaluate maturity across four dimensions.

Agent Effectiveness
The first dimension is all about the output quality. If agent responses are not grounded, consistent and reusable, orchestration does not matter.
| Key Performance Indicator (KPI) | Description |
| Grounded response accuracy | % of agent responses that are verifiable and consistent with enterprise data or trusted sources. |
| Hallucination rate | % of responses that are unverifiable or inconsistent with known context. |
| High confidence response rate | Responses meeting predefined confidence thresholds suitable for automated downstream consumption |
| RAG retrieval accuracy | Accuracy of relevant documents or embeddings retrieved to support generation. |
| Vector DB freshness impact | % of responses relying on knowledge updated within defined freshness thresholds. |
| Agent capability reuse rate | How often existing deployed capabilities are invoked instead of creating redundant agent logic. |
| Agent-to-Agent invocation ratio | % of executions involving registered agents as part of coordinated workflows. |
| Agent discovery coverage | % of agents/tools discoverable via registry/scanners |
At early maturity, teams track latency but at advanced maturity we need to be able to track factors such as hallucination trends over time, retrieval quality drift, knowledge freshness degradation and capability duplication.
If you cannot measure grounding and reuse, your agent ecosystem will fragment rapidly. Centralized orchestration, registry visibility, and traceability makes these KPIs measurable across distributed agents.
Agent Performance
Agent performance is not just about speed, it is about observability across distributed, multi-agent workflows.
| Key Performance Indicator (KPI) | Description |
| Agent response latency | End-to-end time from invocation to response. |
| Throughput (tasks per second) | Number of workflows completed under normal operating conditions |
| End-to-End agent trace coverage | Percentage of executions fully traceable across agents, integrations, and downstream systems. |
| Agent workflow error rate | Percentage of agent workflow executions that fail, error out, or produce incomplete outcomes, including tool invocation failures, timeout errors, and unhandled exceptions |
| Time to Detect (TTD) | Average time to identify abnormal behavior or incident |
| Mean Time to Resolution (MTTR) | Average resolution time for agent-related incidents |
| Routing efficiency/Optimization rate | % of requests optimally routed (correct model/tool selection, fallback success) |
Most AI pilots monitor response time. Enterprise AI platforms monitor:
- Cross-agent trace continuity
- Orchestration failure patterns
- Drift in invocation patterns
- Detection and recovery latency
Unified traceability is critical when agents invoke APIs, other agents, and downstream systems. Without trace coverage, root cause analysis becomes guesswork.
Developer Efficiency & Platform Savings
Scaling agents blindly is expensive. Token consumption grows, model invocations spike, redundant calls multiply and rollback failures cost infrastructure. Efficiency becomes a board level discussion.
| Key Performance Indicator (KPI) | Description |
| Token Cost per Task | Average LLM token consumption per completed workflow |
| LLM spend reduction via Model Routing | Reduction in spend achieved through intelligent routing to cost-appropriate models |
| Cache Hit ratio | Percentage of agent requests served via cache rather than invoking LLMs or downstream systems |
| Compute cost savings from auto-Remediation | Infrastructure cost avoided through automated anomaly detection and remediation |
| Automated rollback success rate | Percentage of failed deployments or changes successfully rolled back automatically |
| Model utilization efficiency | Distribution of workload across models vs cost tiers |
| Budget compliance rate | % of workflows operating within defined token/spend limits |
If your system design lacks the right foundations and is not well architected, AI spend will be unpredictable. Mature organizations measure:
- Cost per business outcome
- Spend per workflow
- Rollback reliability
- Remediation automation
Orchestration level visibility is what enables model routing governance, execution tracing, and lifecycle controls, turning AI cost from reactive to managed.
Governance & Security of Agents
This is where orchestration becomes controlled. Agents operate in dynamic, generative contexts. Governance must be measurable.
| Key Performance Indicator (KPI) | Description |
| Agent Registration Coverage | Percentage of enterprise agents registered in the Fabric registry |
| Policy enforcement success rate | % of policies successfully enforced vs bypassed |
| Policy Violations Prevented | Number of blocked or remediated actions through enforced controls |
| Agent Lifecycle Approval Time | Average time to onboard and govern a production agent. |
| Safety Violation Rate | Percentage of responses flagged for responsible AI violations |
| Prompt Injection Detection Rate | Percentage of adversarial attempts successfully detected or blocked |
| Unauthorized Access Attempts Blocked | Number of authentication or authorization failures intercepted |
| Secret Rotation Success Rate | Percentage of credential rotations completed without service disruption |
| Zero-Retention Compliance Rate | Percentage of interactions executed under verified zero data retention policies |
| LLM interaction governance coverage | % of LLM calls governed via centralized gateway |
| MCP governance coverage | % of MCP interactions validated, secured and policy enforced |
| A2A interaction governance coverage | % of agent to agent interactions governed and validated |
| PII/Sensitive data detection rate | % of interactions scanned and flagged for sensitive data |
If you cannot answer the following questions, then orchestration is not controlled. It becomes delegation without oversight.
- How many agents exist?
- Which ones are governed?
- Which ones violated policies last quarter?
- How often prompt injection attempts were blocked?
Centralized governance control points make these metrics measurable at scale.
Measuring Agent Maturity
A practical way to evaluate your organization:
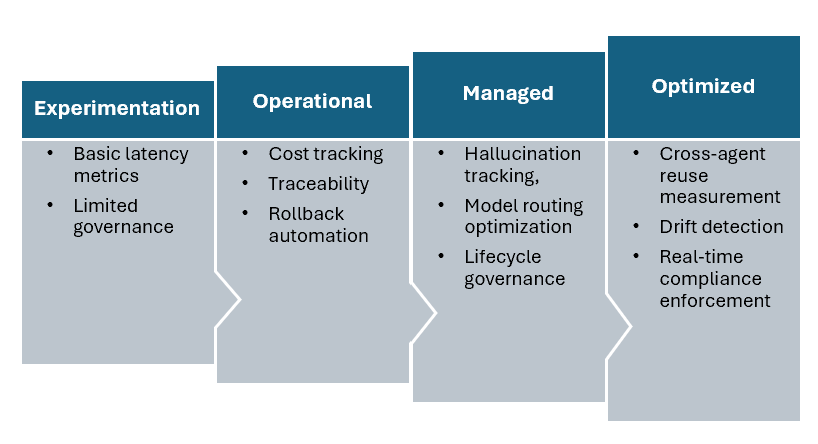
Scaling agents without progressing across these stages leads to:
- Escalating AI spend
- Governance blind spots
- Duplication of capabilities
- Production instability
An Operational Checklist for CIOs and Architects
Before expanding your agent footprint, ask yourself the following questions:
- Do we measure grounded response accuracy and hallucination rate?
- Can we quantify cost per agent workflow?
- Is every agent registered and governed?
- Do we have full trace coverage across agents and APIs?
- Can we detect and block prompt injection attempts?
- Do we measure reuse versus duplication of agent capabilities?
- Is AI spend trending with business value delivered?
If the answer to these is unclear, orchestration alone will not solve the problem, measurement will.
Final Thought
The next phase of enterprise AI will not be won by teams who build the most agents. It will be won by teams who govern and control them. MuleSoft as an ally enables orchestration, KPIs enable control and together they enable scale.
Agentic systems are not just about connecting agents, they represent a journey from orchestration to measurable control, making:
- Agent behavior observable
- AI spend predictable
- Governance enforceable
- Performance diagnosable
- Lifecycle measurable
Enterprises that treat orchestration purely as a coordination layer will eventually hit scale limits. Those that treat it as a measurable control plane will scale responsibly.
From Framework to Execution
MuleSoft Agent Fabric establishes a unified control plane to discover, orchestrate, govern and observe agents across ecosystems. The AI Gateway extends this control to LLMs, MCP, and A2A interactions with intelligent routing, unified access and centralized policy enforcement. Together with MCP Bridge and Omni Gateway, enterprise systems become agent ready while ensuring consistent security, cost control and end to end observability.
At some point in a board meeting or in a risk review meeting or during an incident troubleshooting, someone is going to ask: what exactly are the agents doing and how do you know? The organizations that can answer these questions with confidence, backed by data and governance records will have earned the right to scale. Measurement is not the boring part of agentic AI. It is the part that makes everything else sustainable.
Footnote: It is important to distinguish between two categories of metrics:
- Native Metrics – Directly observable through Agent Fabric orchestration telemetry, registry visibility, and Anypoint Monitoring capabilities.
- Enabled Metrics – Not surfaced as pre-built dashboards, but made measurable because Agent Fabric centralizes orchestration, governance interception, traceability, and execution metadata.


