
Since our Anypoint Platform October 2018 release, you’ve likely heard us talking a lot about the application network graph. We have continued to build on this foundational release and increasingly the application network graph is driving intelligence across Anypoint Platform.
Customers are looking to leverage the application network graph within their own application networks. This blog charts where we have come from, and how we are leveraging the graph to take application network intelligence to a new level.
Graphs: human- and machine-friendly
For those new to the subject of graphs, in computer science circles, a graph is more than a picture with an x- and a y-axis. A graph is a mathematical construct used to represent networks — networks being collections of objects that are related in some way. The study of graphs is, in essence, the study of relationships.
This is important as the value in data comes from finding and understanding the relationship between the different data points. In our industry, Facebook is the example most often cited when explaining the value of graphs, and whilst we understand this value intuitively (I can see who my kids are hanging out with), let’s break this value down in a little more detail.
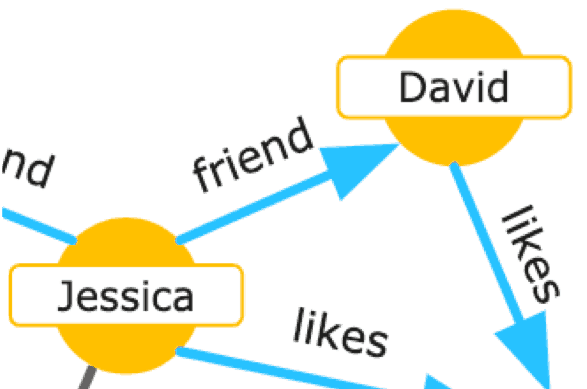
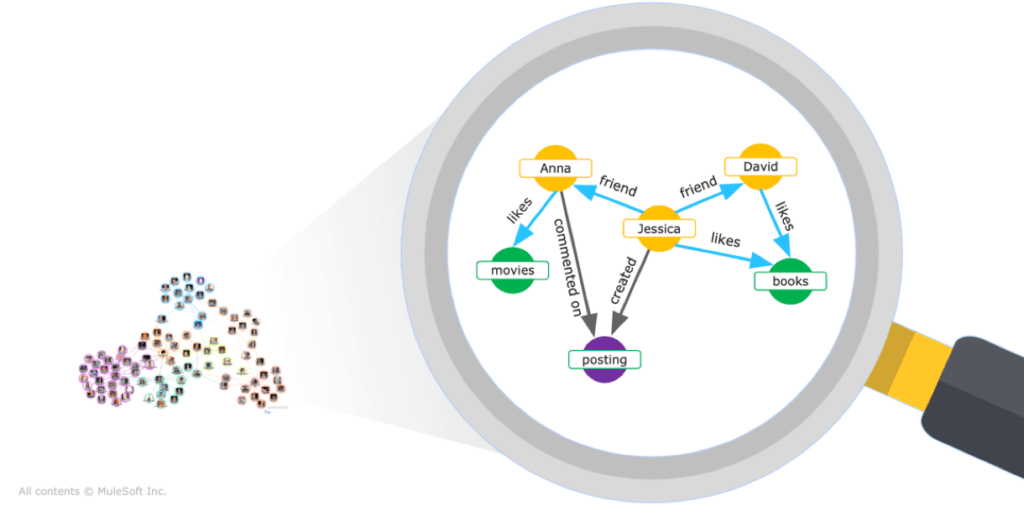
One of the cool things about graphs is they can be displayed visually. A graph can be shown simply as a group of dots with lines connecting them. Dots can represent anything from people to pets and lines between the dots means they are related in a certain way. For example, a line between two people means that Jessica is a friend of David.
Human brains can struggle to process data in raw formats. They can, however, easily spot patterns when they are displayed in certain visual formats – such as a graph visualization. Humans viewing data relationships formatted as a graph visualization can easily spot unexpected connections, hidden patterns, and outliers. Even someone who has never worked with graphs before or someone with no data analysis experience can follow the connections and pick out some interesting patterns. This means your analysis tools can be used by the widest possible audience.
Not only can graph data be made human-friendly but, in a raw format, it’s machine friendly. When data and relationships are modeled in graph format and stored in graph databases, machines can process this data much more rapidly than with traditional relational databases. This allows organizations to analyze large amounts of transactional data rapidly to detect patterns in real-time. For example, organizations can analyze patterns between customer, social, and product data in real-time to detect fraudulent social media accounts that can invalidate marketing intelligence. Queries that track this type of fraud can run in seconds, and users get a visual representation of the results showing the data relationships.
As discussed, graphs provide a handy way to represent relationships between objects, and we can gain a lot of useful insights through displaying these graphs visually and crunching the data in real-time. So how do we apply this to the application network?
Anypoint Platform intelligence
An application network is the way to connect applications, data, and devices through APIs which expose their assets and data on the network. It follows, then, that an application network graph contains all the information of systems and their metadata and how they relate to each other. This includes a catalog of APIs, the versions, developers, and consuming applications. At a high level, our goal is to bring a higher level of intelligence to our application network by leveraging the relationships stored in the application network graph. This happens on a number of levels.
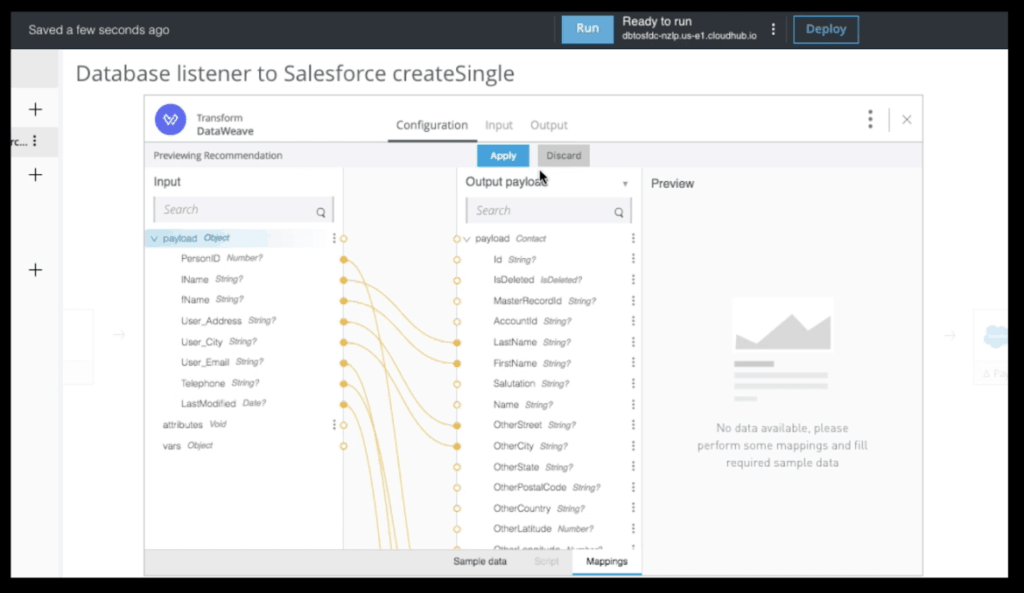
Design intelligence: The focus here is toward methods to further automate and industrialize the process of building connections. Flow Designer’s auto-mapper accelerates connection building through auto-complete suggestions. These suggestions are derived through the analysis of other Flow Designer integrations stored in the application network graph. We can envision a day when a data element in an enterprise data model changes and our design tools are able to suggest a reconfiguration of the complete application network to accommodate this change.
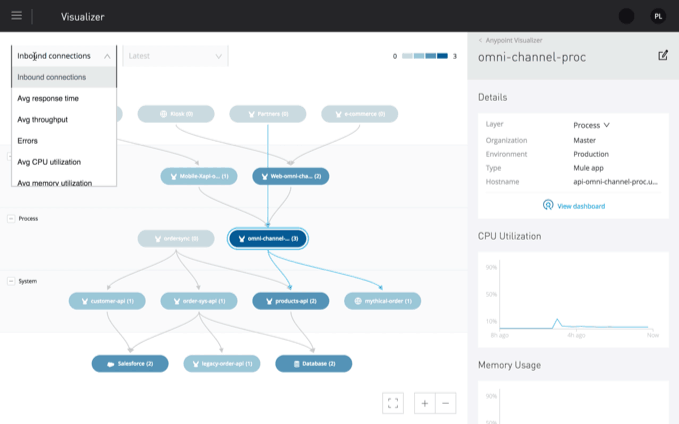
Operational intelligence: Anypoint Visualizer is a graph visualization of the relationships between the assets that make up an organization’s application network. This visualization delivers the intelligence needed to rapidly diagnose operational issues on the application network. If the application network is not performing to SLA, Anypoint Visualizer is able to detect the root cause through interrogation of dependency mappings stored in the application network graph. Once the problem area has been identified, corrective operational tasks can be triggered. In this way, Anypoint Platform turns the application network into an intelligent self-healing system.
Security intelligence: The application network graph is able to store information that enables us to detect and protect against threats and vulnerabilities. The API gateway includes the capability for security policies to query the application network graph in order to make intelligent decisions about the usage patterns of API. Many API attack vectors have recognizable fingerprints which can be modeled and matched using graph technology.
Engagement intelligence: This is achieved through personalized search and discovery. Through the application network graph, we know who is using a particular API, how they are using it, and how that usage impacts the rest of your application network. With API Community Manager, we’re able to surface that insight through analytics. This provides the insight needed to drive improved API performance and adoption amongst API communities.
The application network graph is a foundational technology required to provide you with a more intelligent application network. Increasingly, this technology is being leveraged by the different components in Anypoint Platform, including Flow Designer, Visualizer, and our new Community Manager. Through these tools, your organization will acquire the intelligence to rapidly deliver secure and reliable integration assets.
Happy graphing!


