
As an IT professional, have you ever been in a situation where you know something is broken, but you can’t manage to spot where it is coming from?
It is frustrating and quite time-consuming. You can try to use “divide and conquer” to determine the root cause. Step by step, you reduce the problem space until you isolate the origin of the issue. Yet, in most cases, you still don’t fully know what complex chain of events led to the pain.
Albert Einstein once said that if he had one hour to save the world, he would spend fifty-five minutes defining the problem and only five minutes finding the solution: “The problem is to know what the problem is.”
Because most of us are not Einstein, read this blog post and find out how we can help you define the problem in the context of an application network in – hopefully – less than fifty-five minutes.
How can an application network help you find the problem?
If you are familiar with MuleSoft, you might have heard about application networks. An application network is a network of applications, data, and devices connected with APIs to make them pluggable and to create reusable services.
An application network might have many nodes, and each node may have many edges, which define the interactions with other nodes. The more connected you are, the more nodes and edges you have. It is very good to have many nodes and edges because more reusable applications and services are plugged into the network, but it is also harder to find where problems are when they occur.
To help find where problems are and to give you visibility, we propose an end-to-end API chain correlation where each edge in the application network is monitored with a correlation ID. The idea is that every single call in the network should be easily associated with correlated previous calls in the chain.
In this blog, we will explain how to use Anypoint Platform along with Splunk capabilities to accomplish this end-to-end correlation.
The capabilities
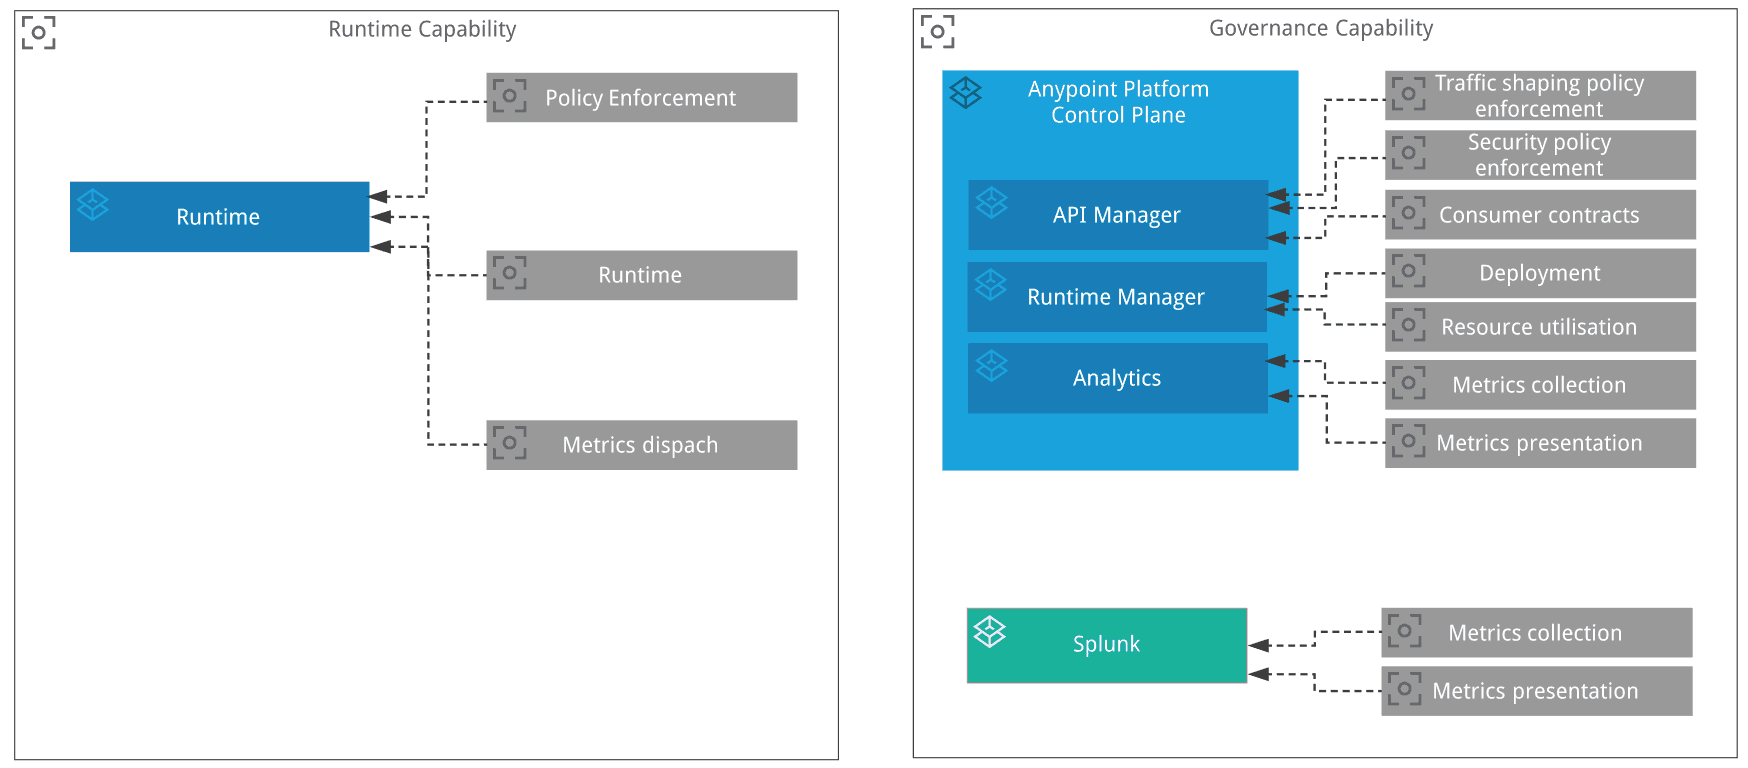
The platform capabilities we will use are highlighted in the following diagram. You can see three important components:
- Mule Runtime: This is the place where the Mule applications are deployed. The Policy Point of Enforcement (PoE) is also executed in the component.
- Anypoint Platform Control Plane: This is the place where an operator manages API policies, including any custom policies. This is also the place where administrators deploy Mule applications.
- Splunk: This is the place where we visualize all the metrics from the runtime. Splunk will correlate the metrics and display them for the end-user.
The configuration
What does it take to make it work? We are going to perform 4 main activities. They are described below as steps A, B, C, and D.
A. Create and apply a correlation custom policy
You can create a custom policy using Anypoint Studio. Each custom policy is an XML file which looks like a normal Mule application. Each custom policy uses message processors, similar to any Mule application.
The message processors in the policy XML file evaluate and process HTTP requests and HTTP responses. The policy can also filter HTTP requests and can match the headers in this HTTP request to a configurable parameter defined in the respective policy YAML file. The match is evaluated using a regular expression (MEL). It simply checks the existence of this configurable parameter. If it does not find the HTTP header, it creates one with the randomUUID. The policy also sets the HTTP status 403 to indicate an error whenever a request does not match the conditions of the filter.
You can download this sample custom policy from here.
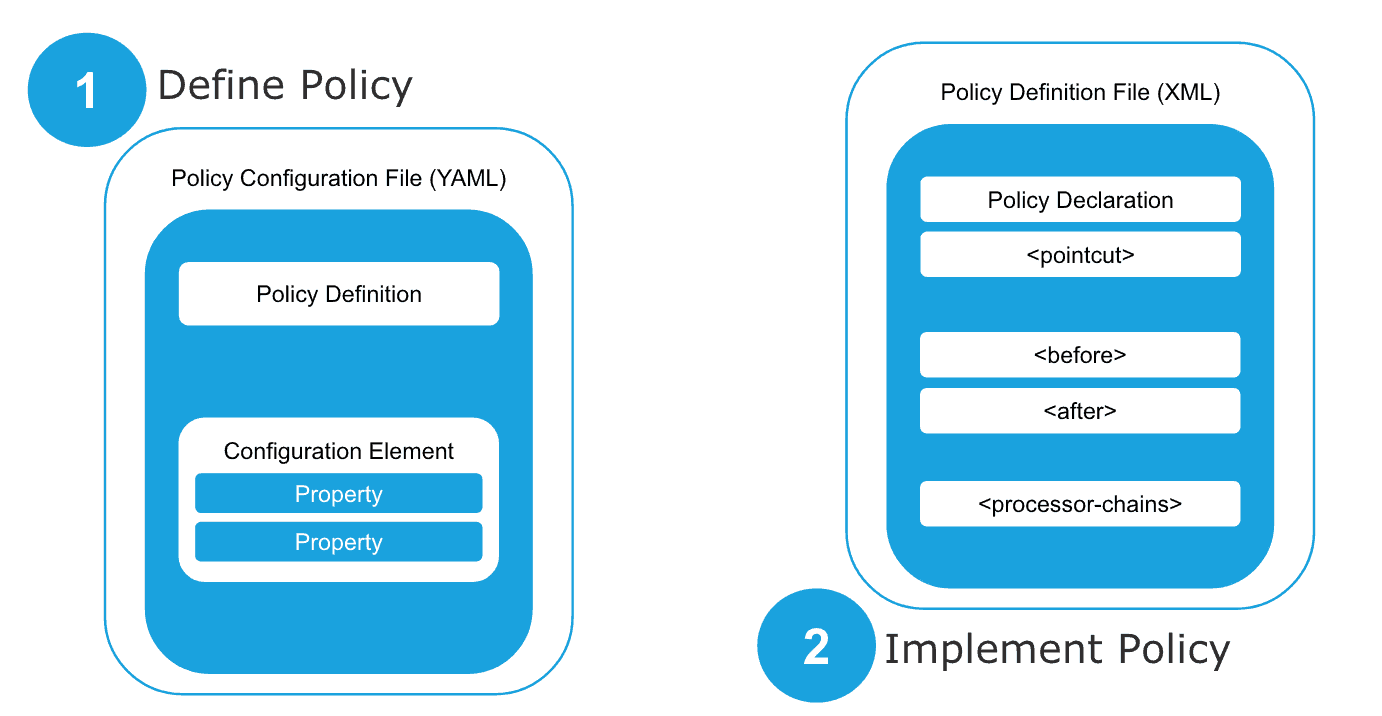
A custom policy is made out two parts:
- Custom policy definition file (YAML).
- Custom policy configuration file (XML), which is basically a Mule flow that implements what the policy must do.
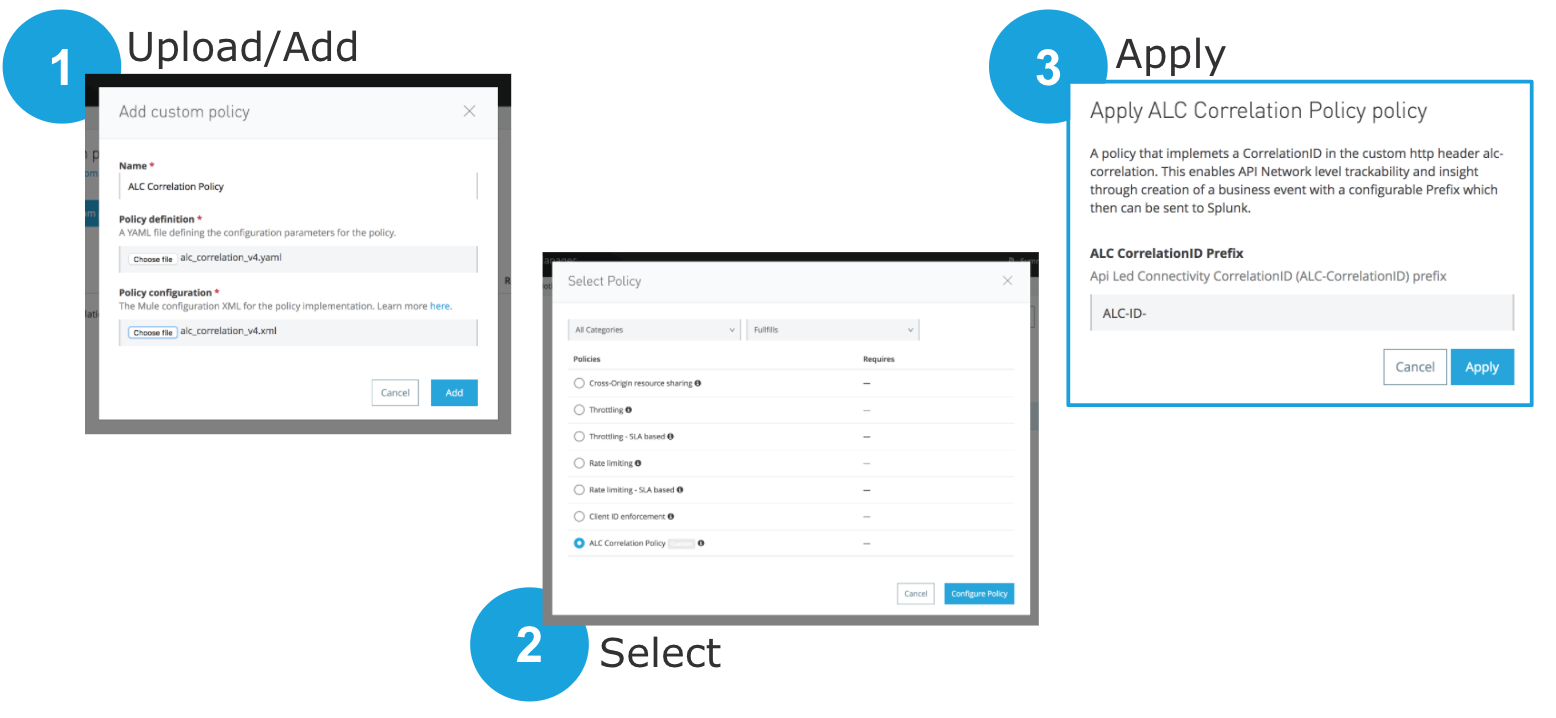
After you have made these two files, you should upload them via Anypoint Platform’s API Manager. After this policy is available, you are then able to apply it to each single API you already have in API Manager.
For more information about custom policies, please check this documentation.
B. Configure the runtime to send metrics to Splunk
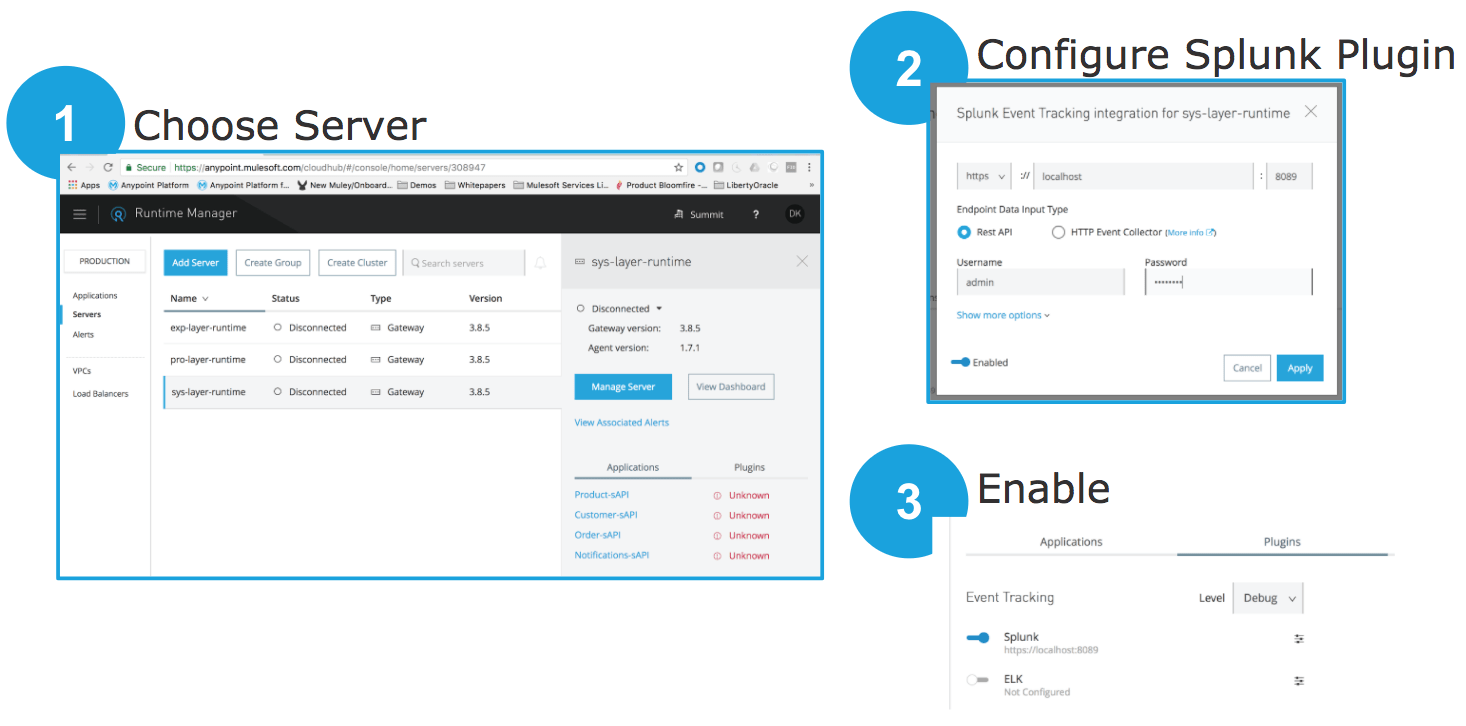
You must now configure the Runtime Manager agent to send metrics to Splunk. This is done in 3 steps:
- Navigate to the Runtime Manager and choose the runtime server where you want metrics to be collected and sent to Splunk. You can have one runtime server, or multiple. Your Mule applications can be deployed anywhere.
- Configure the Splunk plugin agent with the correct host, port, username, and password
- Enable event tracking.
For more information about custom policies, please check this documentation:
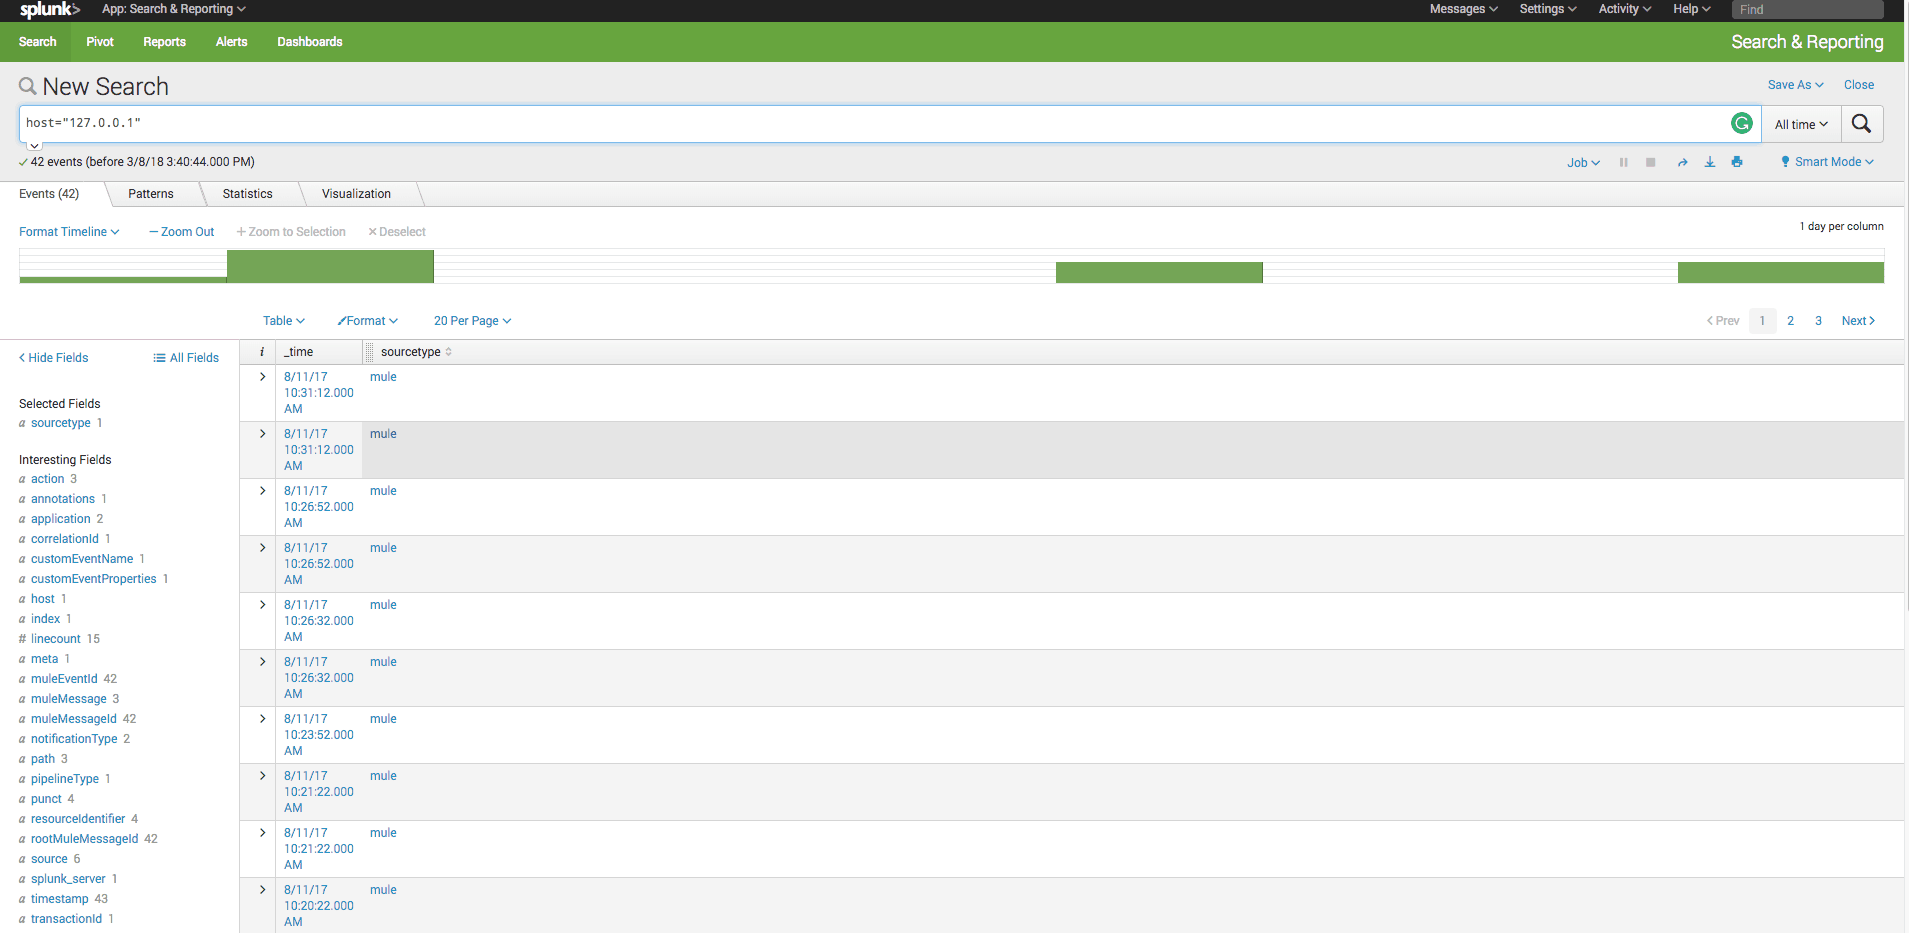
C. Configure Splunk
You need to have Splunk installed. When we previously did the end-to-end API chain correlation, we did not need to make any special configuration in Splunk. Once we have Splunk up and running, and the events from Mule runtime are sent to it, we can make queries on Splunk. The example below shoes one query that gets all the API calls with the correlation id ALC-ID-92a3fde7-609a-4a21-b745-732bf7305d1e.
host="127.0.0.1" | spath application | spath muleMessageId | spath notificationType | spath customEventProperties.alc-correlation | transaction muleEventId, customEventProperties.alc-correlation | search customEventProperties.alc-correlation="ALC-ID-92a3fde7-609a-4a21-b745-732bf7305d1e" | eval exception_occured=if(action="exception",200,10) | eval previous_application = case (application = "Product-sAPI", "Mobilei-Channel-xAPI", application = "Customer-sAPI", "Mobile-Channel-xAPI", application = "Order-sAPI", "Order-Fulfillment-pAPI", application = "Notifications-sAPI", "Order-Fulfillment-pAPI", application = "Order-Fulfillment-pAPI", "Mobilei-Channel-xAPI") | table previous_application, application, exception_occured | dedup previous_application, application
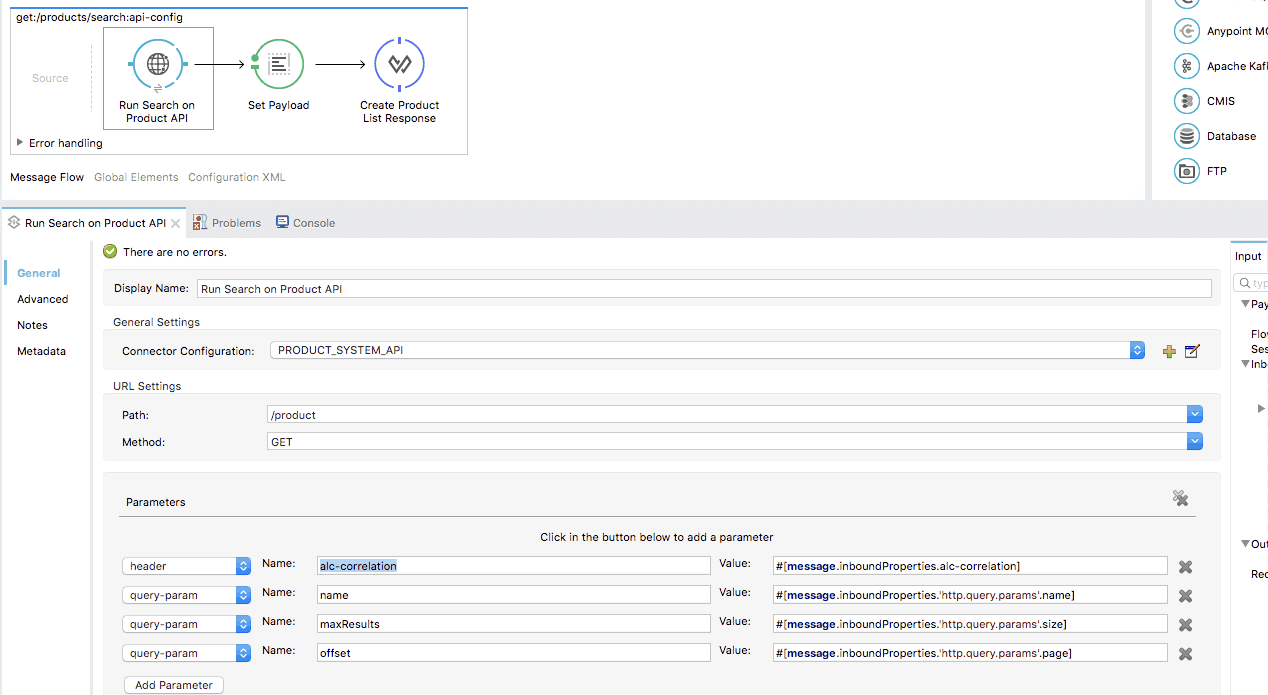
D. Configure the Mule applications
The Mule applications which implement the APIs still need to have the configurable HTTP header passed further to the next HTTP request. This is done by adding a header with the same name in the HTTP request parameters. The picture below shows how the “alc-correlation” HTTP header is passed.
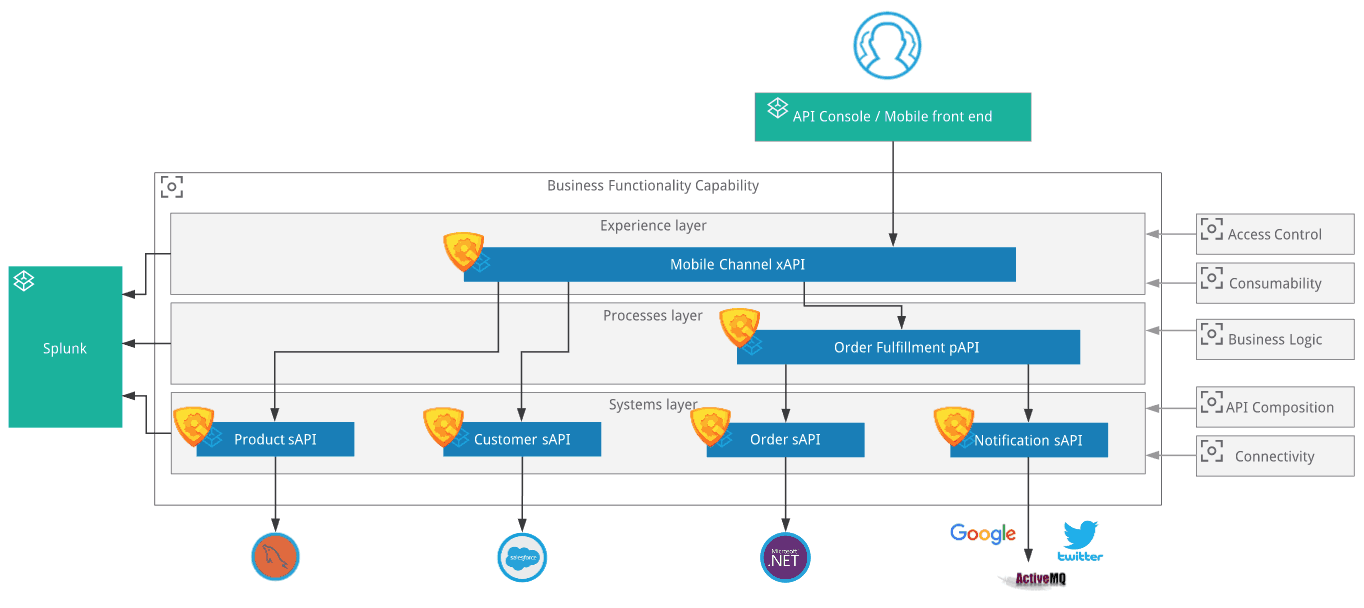
A scenario
Now I’ll illustrate one situation with an example of a mobile app application that consumes a Mobile Channel Experience API. Behind this Experience API, we have a couple of Process and System APIs. The picture below shows all six APIs. Each one of these APIs uses this custom policy. When the mobile application sends the very initial request, the custom policy verifies if the correlation ID on the HTTP custom header is present. In the example, the correlation ID HTTP custom header is called alc-correlation.
If alc-correlation header is not present, the policy raises an exception and returns a “403 – Not authorized” response. When the alc-correlation HTTP custom header is present, every call made on the edges of the application network will also contain this data. If a correlation ID is empty, the policy can generate one. When an exception happens inside a particular Mule application, the user will know which chain of events originated the call and what is the potential impact on this same chain for this particular execution.
We hope this short blog post clarifies how we can help you gain more visibility into possible errors and how you can make your application network more robust by simply extending Anypoint Platform capabilities with an external analytical tool such as Splunk.
Learn more about application networks.


