
MuleSoft Anypoint Runtime Manager (ARM) provides connectivity to Mule Runtime engines deployed across your organization to provide centralized management, monitoring and analytics reporting. However, most enterprise customers find it necessary for these on-premises runtimes to integrate with their existing monitoring systems such as Splunk and ELK to support a single pane of glass view across the infrastructure.
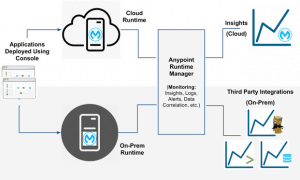
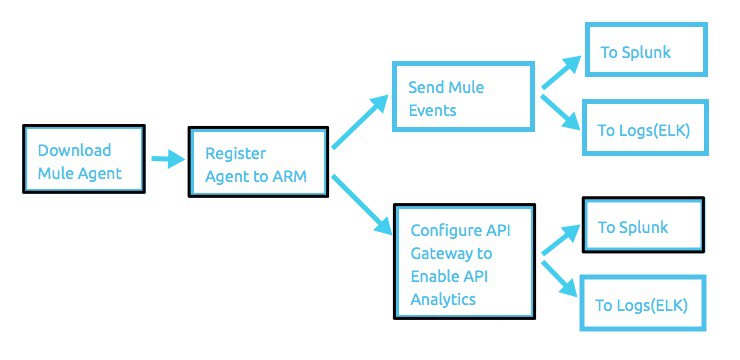
This HowTo article includes 3 parts to describe an example of configuration changes needed to set up a Mule runtime: 1) register an agent to a runtime manager, 2) configure a gateway to enable API analytics to be sent to Splunk – as highlighted in the following diagram and 3) setup dashboards. However, the provided information can be used to set up similar configurations for other similar use cases.
The 3 major steps are:
- Setup the latest version of Mule Runtime with latest Mule Agent
- Configure Mule Runtime to report metrics to Splunk
- Build new and import existing dashboards/reports in Splunk for monitoring/management
Pre-requisites:
- Access to a Spunk installation
- Download Mule EE Runtime, Mule Agent and valid license file.
Step 1: Setup the latest version of Mule Runtime with latest Mule Agent
Unzip the EE Runtime:
tar zxvf mule-ee-distribution-standalone-3.8.0.tar.gz –C .
To ensure the latest version of the agent, copy the agent-setup zip file to the $mule_homebin directory and unzip it:
cp agent-setup-1.4.2.zip mule-enterprise-standalone-3.8.0/bin
cd mule-enterprise-standalone-3.8.0/bin
Unzip -o agent-setup-1.4.2.zip
Execute the following command to update runtime libraries with the latest version of the agent (if any):
./amc_setup –U
The runtime setup is complete. Let’s register the standalone runtime with its manager before we start it.
To register the runtime with the Anypoint Runtime Manager (ARM), sign in to Anypoint Platform account web console. Navigate to Runtime Manager -> Servers , Click on Server, Add Server to view a sample command which includes the code for the runtime to register itself to your organization.
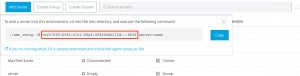
Execute the command at the terminal with a unique name as the last argument so it can be uniquely identified.
./amc_setup -H 2478c889-869a-4ebe-b315-8a5b6a5bc425---8513 <server_name>
or on Windows:
amc_setup.bat -H 2478c889-869a-4ebe-b315-8a5b6a5bc425---8513 <server_name>
The setup is now complete. Execute the following command to start the runtime:
./mule
The runtime should now start up and report to its Manager (ARM). Confirm its status is Running by switching to ARM web console.
Step 2: Configure Mule Runtime to report metrics to Splunk
In the Splunk page, click on Settings,Data Inputs and HTTP Event collector.[Note: An alternative approach would be using REST APIs, but using Event Collector is the recommended by Splunk.]
Ensure that the Tokens are enabled in the Global Setting and make a note of the HTTP Port Number (8088, in this example).
Setup a new token by giving it a name and selecting the default values. You should now have a token with a Token Value, which will be used to configure the security on the Mule side. Copy the value of the token.
Out of the box, Mule Runtime is configured to report its metrics to the MuleSoft’s analytics engine. We need to now change its settings to point it to the Splunk instance. This configuration is stored in the wrapper.conf file in the conf directory in the $mule_home directory.
First, stop the Mule Runtime by executing
./bin/mule stop
Open the $mule_home/conf/wrapper.conf file.
Search for the following two lines and ensure analytics_base_uri is set to empty search for “on-prem configuration” and add a new line to set on-prem = true:
wrapper.java.additional.20=-Danypoint.platfrom.analytics_base_uri=
wrapper.java.additional.23=-Danypoint.platfrom.on_prem=true
Execute the following command to setup domain gateway and start the Mule Runtime:
./gateway_domain_setup
./bin/mule start
The last step in this process is to enable the Splunk plugin from ARM for this specific Runtime. On the Runtime Manager, Select the Server and click on the Plugins.
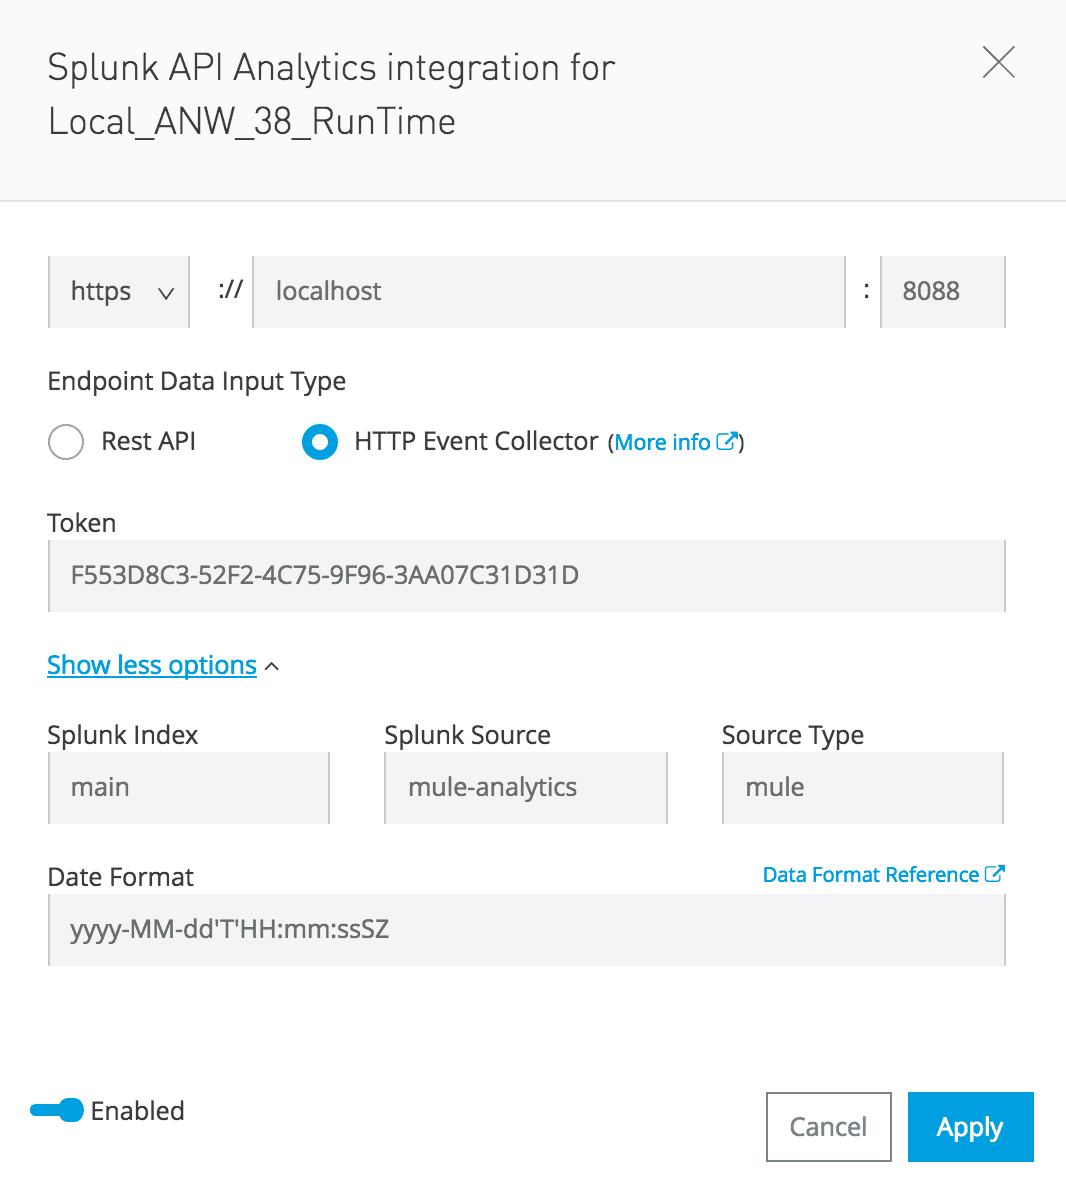
Enable API Analytics and Click on the Configuration button to setup Splunk:

Give it the URL for Splunk’s HTTP Event Collector, provide the token value that was set up earlier and enable the Splunk plugin.
The setup is now complete. [Optional: Check your mule_agent.log file to confirm splunk initialized successfully].
To confirm all analytics are now reporting to Splunk, let’s create an API proxy and deploy it to the Mule Runtime, which will allow the Mule Runtime to act as a gateway and capture the analytics as the requests come in.
From the API Manager web console, Click on Add new API.
Enter Name, Version, and Description.
Select the radio button for Endpoint with a proxy, provide the destination URI and ensure the box for CloudHub remains unchecked.
Click Save and Deploy.
On the next screen Select the Server where you are hosting the runtime and click Deploy Proxy.
Invoke the API calls by triggering the calls to the proxy, either directly from your browser or using a SOAP/REST client. The proxy should forward your request to the underlying server and start capturing the metrics which will now be visible in Splunk.
Step 3: Build new and import existing dashboards/reports in Splunk for monitoring/management
Open the web console for Splunk. Click on Search & Reporting tab on the left.
Validate that you now see the source and some data on the Home Screen under Data Summary.
Splunk can now be configured to view data from Mule run-time is the desired format. Additionally, import the following zip file that includes some examples of pre-built reports. *Please note that the zip file includes examples only and is not meant to be a replacement of an implementation effort to build specific reports your business requires.
Please feel free to read our documentation for more details about reporting analytics from Mule Runtime using Splunk.


