
Governance, visibility, and control are the trifecta requirements for software management. With digital landscapes comprised of APIs, integrations, applications, hardware devices, on-premises systems, and SaaS tools, the companies with the most accurate pulse on their digital landscapes are the ones setting economic and digital trends.
As MuleSoft move to connect anything to everything, we unveiled Anypoint Monitoring at MuleSoft CONNECT 2018, the tool that provides advanced monitoring and out-of-the-box diagnostic capabilities.
Anypoint Monitoring bridges the divide between application performance monitoring and log management, the de-facto monitoring tool types for enterprise-grade visibility. With an integrated monitoring tool, developers, architects, and DevOps teams enjoy granular visibility across various Mule runtimes, APIs, integrations, and other runtime services. Anypoint Monitoring helps customers achieve three key outcomes:
- Reduced mean time to resolution
- Increased uptime
- Improved data-driven business and technical decisions
What is performance monitoring?
Application performance monitoring gives customers granular visibility into all functional aspects of their application network. With Anypoint Monitoring, all insights related to APIs, integrations, and dependencies are extracted automatically, with very low-performance overhead and no required application modifications. More than 40 metrics are also available through built-in dashboards––covering everything from inbound requests, outbound calls, and dependencies to performance, failures, JVM, and infrastructure metrics.

Why performance monitoring in Anypoint Platform?
On average, a single business transaction crosses about 35 different services. As a result, being able to trace and pinpoint bottlenecks, and quickly check for errors across every service is a monitoring must-have.
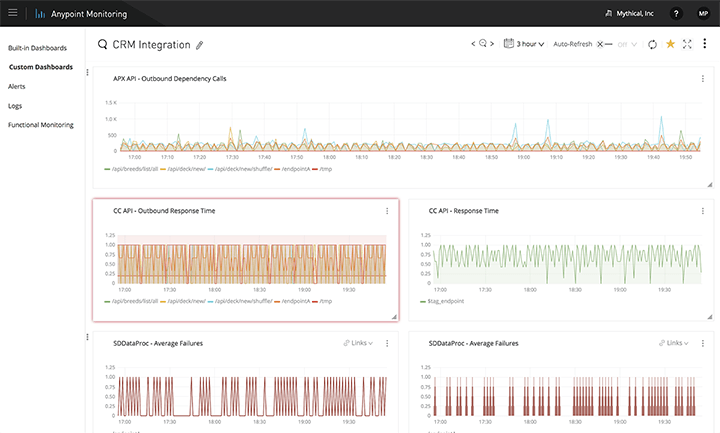
Anypoint Monitoring provides users the ability to trace transactions in real-time (every 5 seconds) and build, save, and securely share custom dashboards to create the relevant views for each application across the application network. A single dashboard can span all of the relevant APIs, integrations, and runtime services relevant to that team.
Out-of-the-box performance monitoring gives detailed visibility without the need for orchestrating another software. But customers have the ability to customize their monitoring experiences with customizable dashboards and advanced query builders. Users can leverage the advanced query builder to search for the relevant pieces of data, and customize the colors and visual representation of their charts and tables. Custom dashboards can also cut across multiple applications to report on broader organization-level activity, adoption, and performance.
Additionally, Anypoint Monitoring combines the best-in-class of performance monitoring and management capabilities with enterprise alerting capabilities. Users can create alerts they need in order to get notifications on serious problems (known as red alerts). With Anypoint Monitoring, users also receive notifications as applications approach infrastructure capacity, allowing users to proactively manage problems before they arise (known as yellow alerts).

What is log management?
Log management comprises an approach to dealing with large volumes of computer-generated metadata. Over the years, the quantity of log data generated has grown exponentially, to the point where customers must consider both how they consume log data and how much data they save.
We’re excited to say that Anypoint Monitoring includes distributed log search, management, and storage at scale. Customers can quickly search and find the raw data that they need to pinpoint issues and extract insights. Log information is automatically captured, enriched, and sent to Anypoint Monitoring where it can be searched and analyzed in real-time.

Why log management in Anypoint Platform?
Log search is deeply integrated into Anypoint Monitoring––enabling developers to drill down into logs from performance monitoring reports. This integrated experience is key to unlocking rapid insights and quickly identifying the root cause of incidents in production.
In addition, log tokenization is included in Anypoint Platform to help customers manage sensitive and personally identifiable information (PII) in their logs. You can tokenize sensitive data at the source before it is sent to the monitoring plane. Tokenization is mathematically irreversible and creates strong guarantees around information protection by replacing the original sensitive data with a random format-preserving value. Customers can choose, based on a permissions model, to detokenize specific values later if needed.
Anypoint Monitoring is designed for hyper-scale storage and has no preset limit on data volumes or retention. Customers can purchase additional storage as needed, and customize the retention period ( how long they want the data to be saved for) to the desired duration. With Anypoint Monitoring, customers enjoy an advanced two-tiered storage architecture that allows control over which data is retained in a fully indexed manner, and which data is stored in raw form at lower costs for long-term retention.
Excited about what you heard? Anypoint Monitoring is GA, and rolling out to all customers in the coming weeks. Anypoint Monitoring currently supports monitoring CloudHub-based runtimes, and will soon support on-premises deployments and hybrid deployments. Get started by logging into Anypoint Platform to see if Anypoint Monitoring has been rolled out to your account.