This is the second in a series about JSON logging. If you want to customize the output data structure you can check part 1 of the blog post. In this post, we are going to explore the new capabilities added in version 2 that were implemented based mostly on user feedback.
Among the features added in this version we have:
- Content field data parsing: To parse data in content fields as part of the output JSON structure (instead of the current “stringify” behavior).
- Dataweave functions: To accommodate desired log formatting.
- External destinations: To send logs to external systems.
- Data masking: To obfuscate sensitive content.
- Scope Logger: For in-scope calculation of elapsed times
Content field data parsing
For those loyal existing users of JSON Logger, you’ve probably noticed the data inside the content field is always “stringified.” While that was by design, I do see value from a readability perspective — so in an effort to provide choice and convenience, as long as the content field output is JSON, they will be parsed by default.
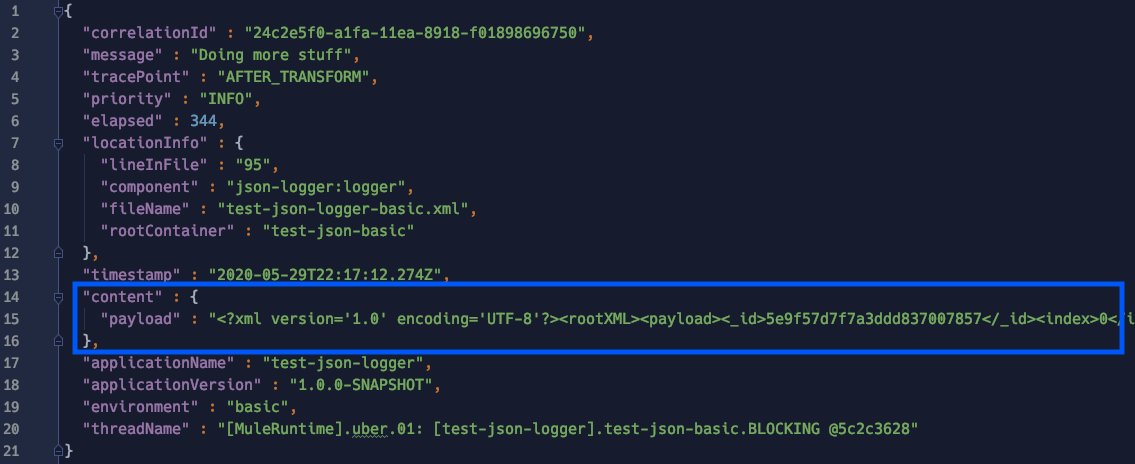
This is what a classic logger would look like on v1:

The data inside the content field (e.g. payload) is hardly readable unless you are using a log aggregation tool with JSON parsing capabilities.
In this release (2.0.0), if the content field output is a proper JSON, it will get parsed as part of the main logger:

If the content is anything else other than JSON, it will stringified as usual:
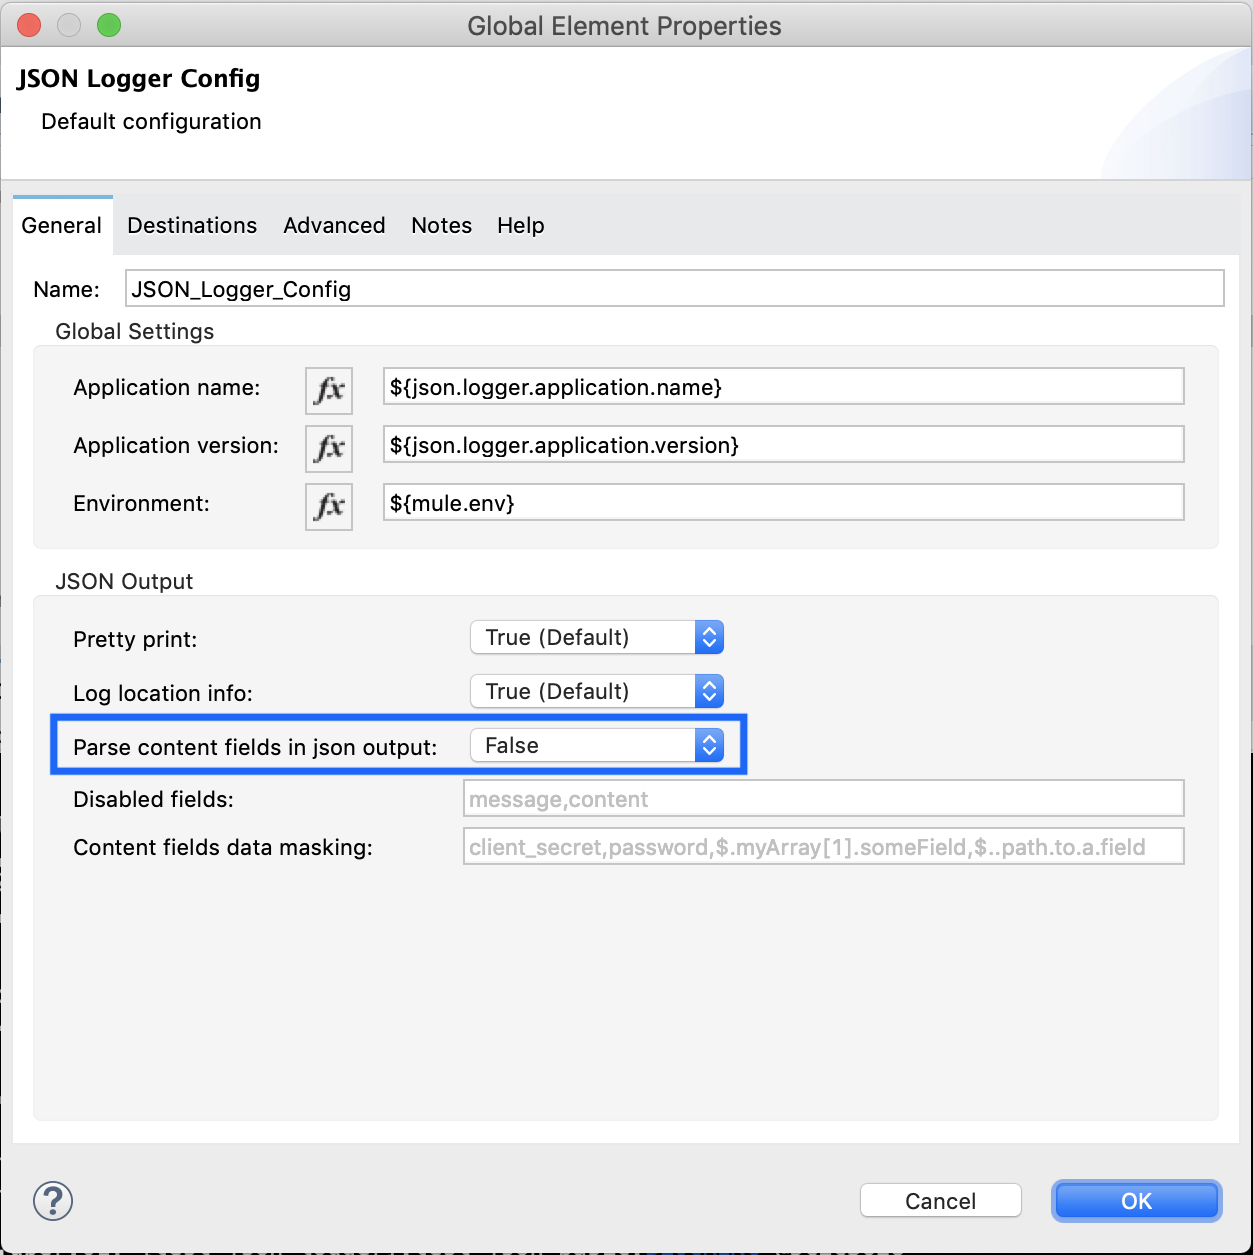
If you still want to keep the previous behavior where everything is stringified, that can be defined globally in the logger configuration:
DataWeave Logger Module
To complement the previous feature, this release includes a Dataweave Module with a set of functions that may be of use for you. Furthermore, the new default logging expression for the content field leverages one of such DataWeave (DW) functions:

DataWeave functions
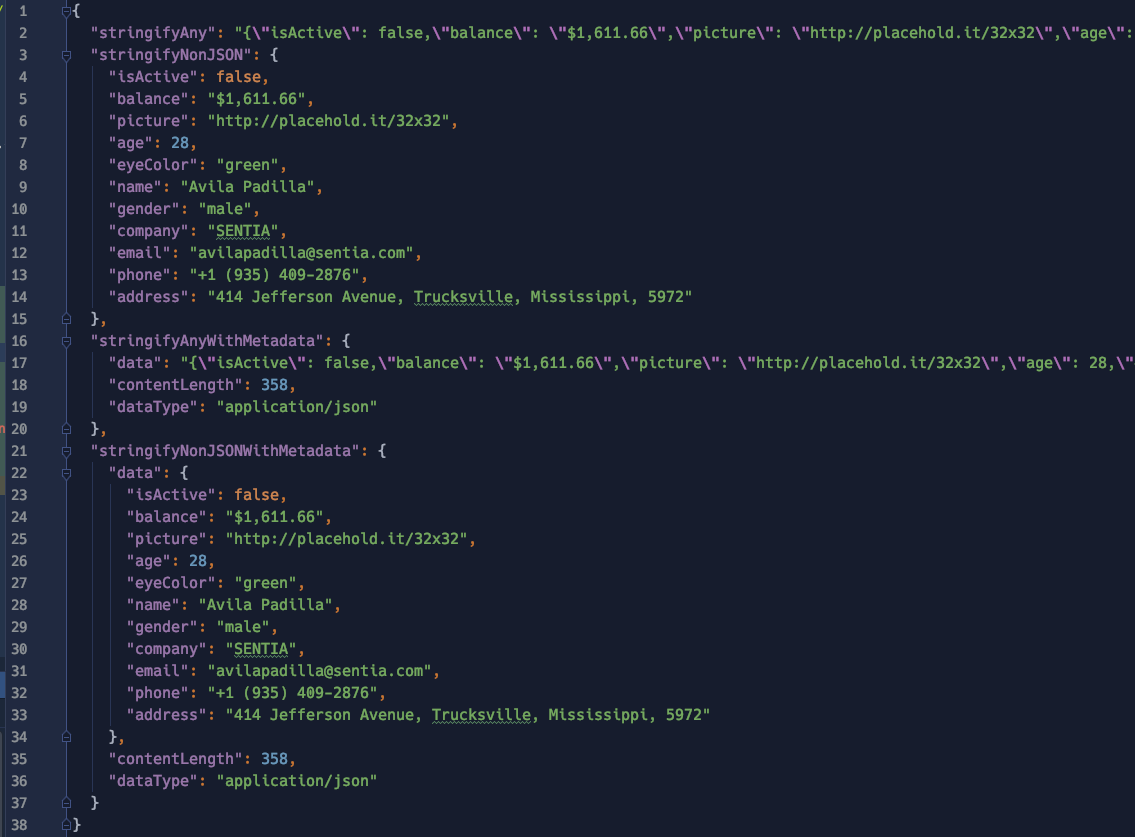
stringifyAny(<DATA>)
It will “stringify” any <DATA> regardless of=content type.
stringifyNonJSON(<DATA>)
It will “stringify” any <DATA> unless it’s content type is “application/json” in which case, it will preserve the JSON content type and structure.
stringifyAnyWithMetadata(<DATA>)
It will “stringify” any <DATA> regardless of content type and will include the following metadata if available:
- data: stringified content
- contentLength: content length of the value
- dataType: MIME type (without parameters) of a value, for example “application/json”
- class: class of the Plain Old Java Object (POJO), for example “java.util.Date”
stringifyNonJSONWithMetadata(<DATA>)
It will “stringify” any <DATA> unless it’s content type is “application/json” in which case, it will preserve the JSON content type and structure, and will include the following metadata if available:
- data: stringified content unless it’s “application/json”
- contentLength: content length of the value
- dataType: MIME type (without parameters) of a value, for example “application/json”
- class: class of the Plain Old Java Object (POJO), for example “java.util.Date”
Note: For details on available DataWeave metadata, check the docs.
Let’s explore how these functions work and what to expect from them. Assuming the following request data with content type “application/json:”

The data will be parsed in the following way for each function:
Tips
One common mistake that developers make is converting payloads to JSON on every single logger (since the default output type of the content field is “application/json,” DW will always try to convert the entire contents to JSON unless you change it to something like “payload.^raw”). This connector release aims to avoid the additional conversion overhead and performance impact by keeping the raw contents in its native format as much as possible (e.g. when dealing with XML or CSV payloads).
Another common mistake is logging entire payloads on every single logger. Given the high performance impact (particularly when working with big payloads), be conscious about when it makes sense to log payloads or not.
External destinations
Depending on your deployment architecture — based on my experience — the preferred way to ship logs should be in this order:
- Leverage log forwarders like Splunk Forwarder or Filebeat (Available only for on-prem)
- Leverage log4j appenders (unfortunately not all platforms provide a supported log4j appender implementation)
In an attempt to provide a third option and facilitate pushing logs to external platforms, a feature called “External Destinations” was added. This configuration allows you to seamlessly forward log entries to the following supported destinations:
- Anypoint MQ
- JMS
- AMQP
Destinations: JMS and AMQP
In order to push logs to JMS or AMQP you will need to:
- Add either of those connectors to your Mule project (the first time you import JSON Logger to your project it will automatically add these dependencies for you so make sure you remove them if not needed).

- Create a connector configuration (AMQP or JMS).
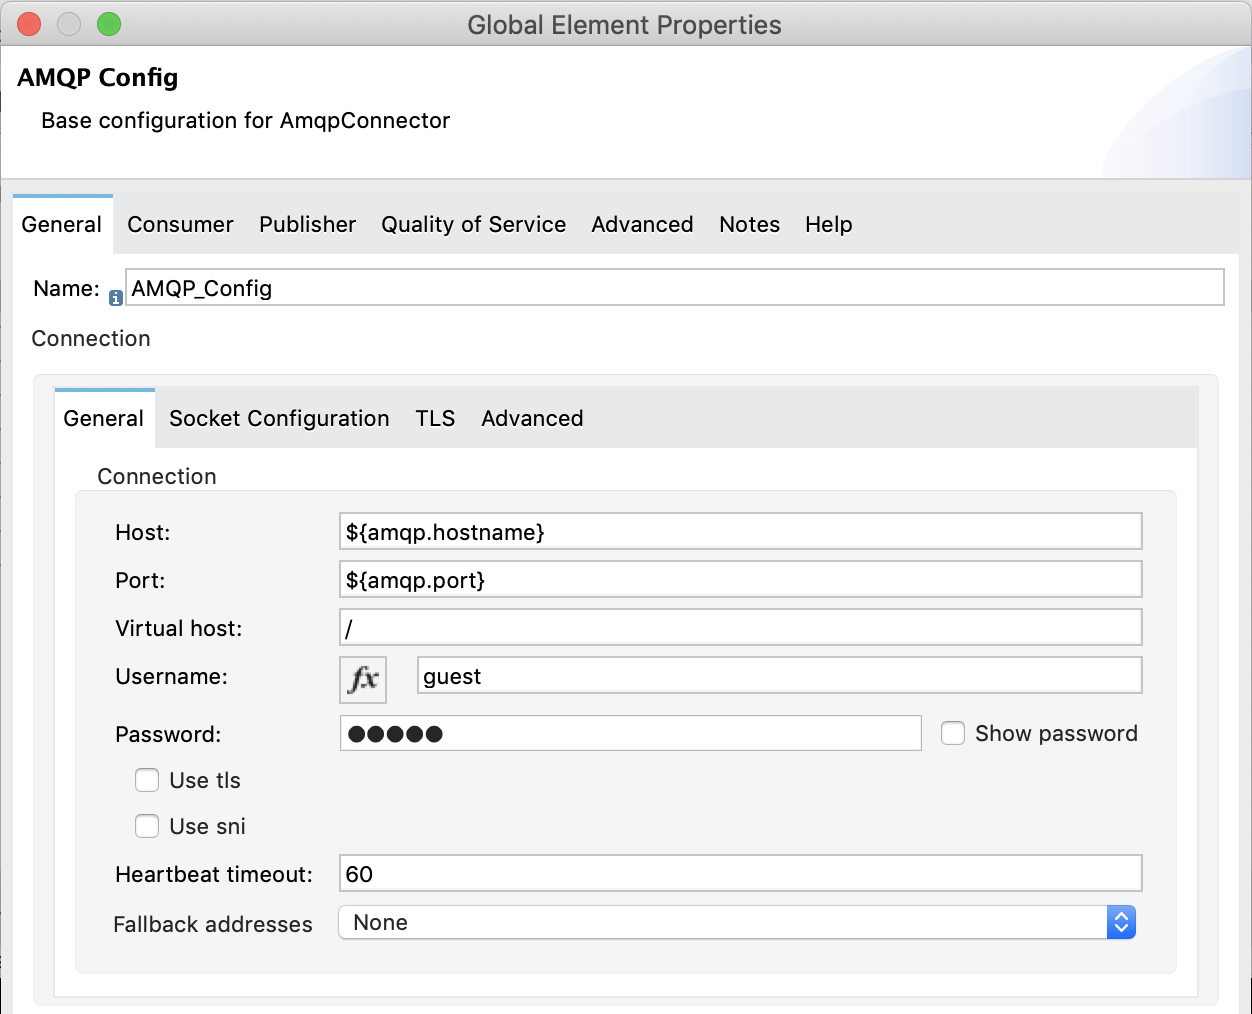
- Pass the name of the connector config to the JSON Logger config along with the name of the destination (e.g. Queue for JMS or Exchange for AMQP).

A couple extra things to note here are “Log Categories” and “Max Batch Size” which are explained below.
Log categories
Since sending logs externally has a direct performance impact on your application, you may want to filter out which logs really need to be published. By leveraging a new capability in this release called “categories” which allows you to specify the associated logger name (by default org.mule.extension.jsonlogger.JsonLogger) of a particular operation, we can filter which categories we want forwarded to the external destination:
- Category configuration (if no value, the default is org.mule.extension.jsonlogger.JsonLogger).
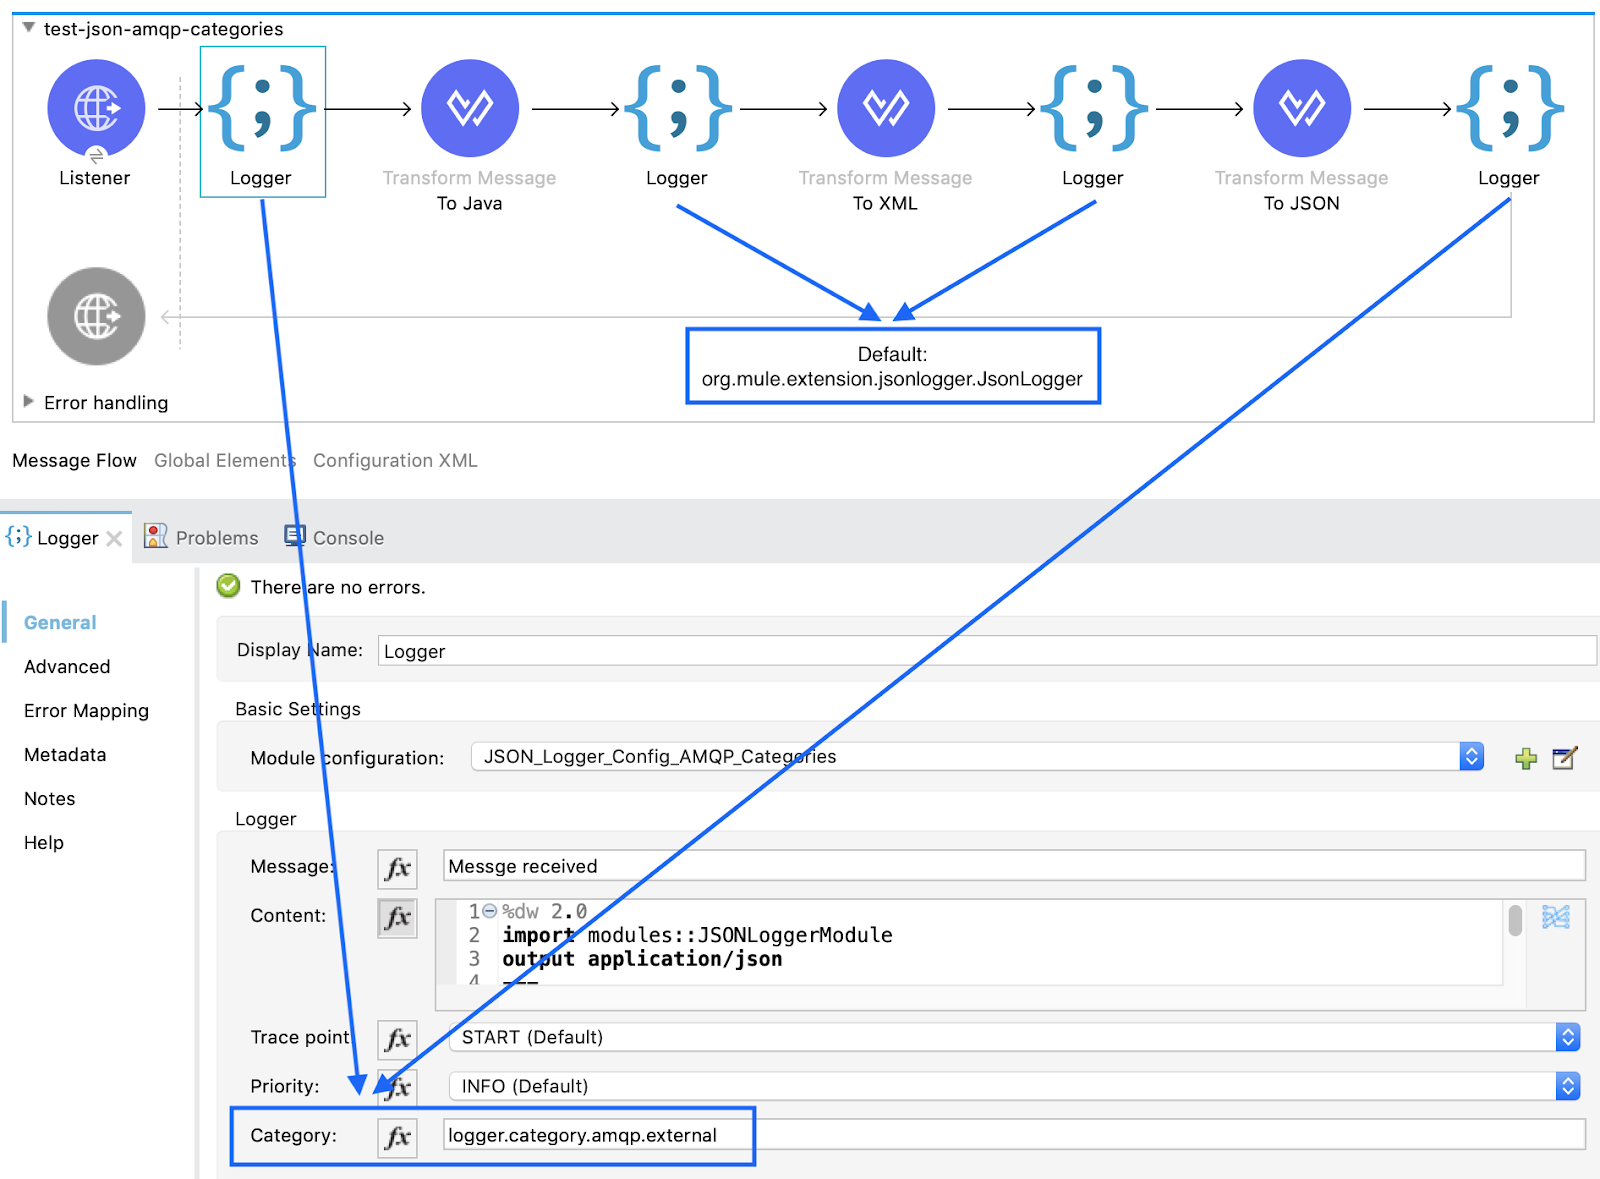
As shown in the image above, the first and last loggers will have a category defined as “logger.category.amqp.external.”
- External destination category filter: Provide a list of categories that should be published to External Destination. If none is specified, it will publish all logs (not recommended).

In this example we are telling the JSON Logger configuration to only send log entries that match the category: “logger.category.amqp.external.”
Max batch size
As mentioned above, publishing logs to an external destination can be a resource intensive task, thus, the logger will internally try to buffer events (depending on how fast logs are generated) and send them in batches. Under high-load conditions, these batches can get large, so to define an upper bound to how big they can get, we set the max batch size (by default set to 25 log events).
Why is this important? Let’s look at another example:
AnypointMQ can ingest messages up to 10MB in size. Assuming log entries of about ~100KB would mean you could potentially buffer up to 100 messages before AnypointMQ starts rejecting them. The buffer is directly consuming heap memory in the JVM, thus make sure you plan appropriately to avoid exhausting your resources.
Destinations: AnypointMQ
In the case of AnypointMQ, the situation is a bit different as the current AMQ connector doesn’t handle messages in the way the JSON Logger needs. Thus, for AnypoinMQ only, the necessary internal logic to publish logs to AMQ was added by leveraging AnypointMQ’s own REST API library (in the same way the connector does it), thus minimizing the amount of custom code required. In this scenario, there is no need for an additional configuration as the JSON Logger config will be self sufficient by providing the additional AMQ specific parameters:
- Queue or Exchange destination
- AnypointMQ URL
- Client App ID
- Client Secret
Published logs
Lastly, what you will get published to your external destination is a JSON array with a size that ranges from 1 to <MAX_BATCH_SIZE> log entries depending on the log generation rates. For example:
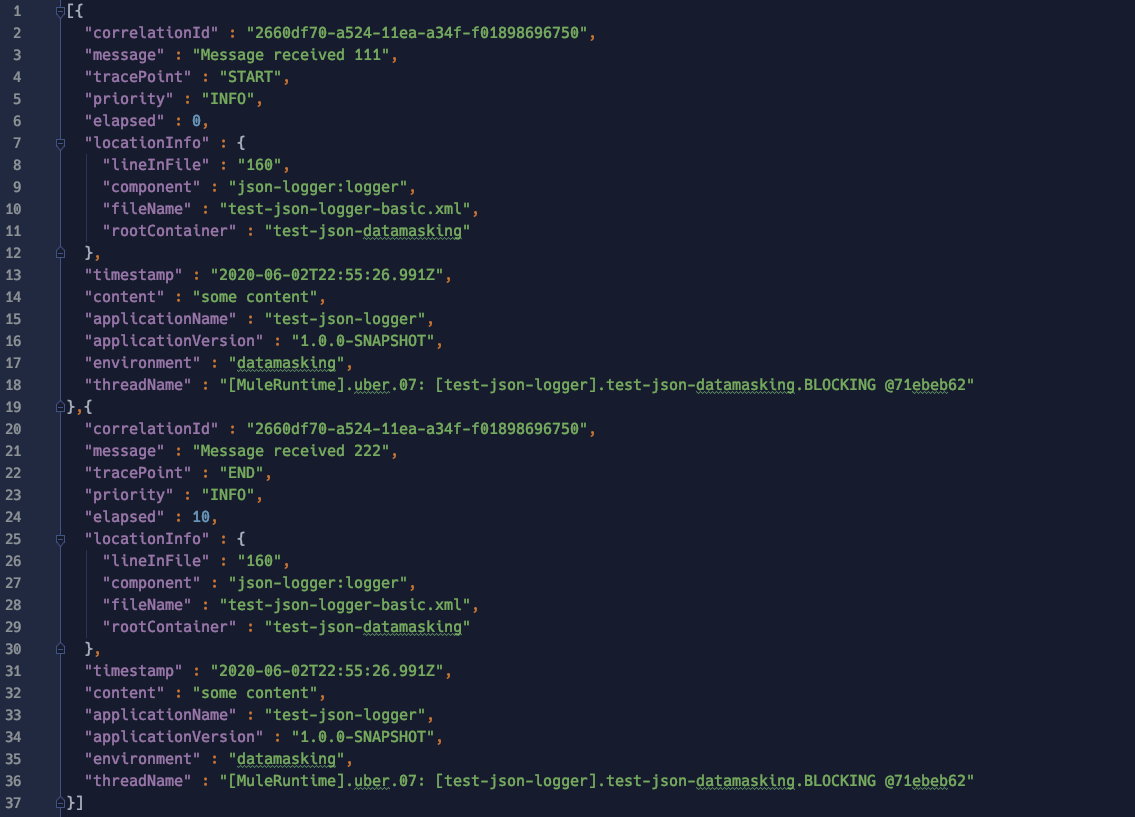
Side effects
Unfortunately, even if you are not interested in using the external destinations capability, by importing the connector from Exchange (in Studio) it will identify the JMS and AMQP connectors as transitive dependencies and preemptively add them for you to your project. Thus, if you are not using this capability you will need to manually remove the unneeded libraries (e.g. JMS and/or AMQP) manually once.
Data masking
Probably one of the biggest requests from customers is for a way to prevent logging sensitive data such as credentials or PII information. Moreover, some people are extending the logger to do payload encryption which may have a detrimental effect on performance, operational complexity (encryption keys, certificates, etc.) and readability.
After evaluating the cost/benefit of different approaches, the following criteria was applied in JSON Logger v2 to support some level of data masking:
- Not have a detrimental impact on performance
- Preserve original data structures (for readability)
- Work only at the content field level (or any field marked as type “content”)
To configure this feature, we need to provide CSVs (with no spaces in between) with the name of the JSON fields and/or JSON paths (relative to the root element inside the content field) that we want masked.
For instance, for the following data structure:

We’ll define the following data masking configuration:

As you can see, we have a mix of field names as well as JSON paths that will give hints to the logger on which data should be masked.
In this example the logger will mask:
- Any JSON field named:
- name
- phone
- The JSON paths:
- $.payload.addresses[1] → indicates that the second address object under the payload parent element should be masked)
- $..state → indicates that “any child” field named “state” should be masked)
Note: The JSON path should be relative to the root element of the content field and not to the payload object itself.
The final output would be something like:

Lastly, notice how the masking algorithm preserves the original data as much as possible (e.g. email structure) which makes the data human readable (e.g. as opposed to full payload encryption).
Tips
In the same way too many logging payloads create a huge performance overhead, be careful to run proper tests on the performance impact of your specific data masking rules, particularly on large data sets.
Scope logger
How many of you have done performance testing and while looking at the logs started to think: “I can do 2317ms, take away 1383ms and figure out how long the API request took based on the elapsed times… but is that the only way?” Well, for those scenarios where we are particularly interested in measuring the performance of an outbound call, the Scope Logger introduces the notion of an “scope elapsed time” (scopeElapsed) which is a calculation specific to whatever was executed inside the scope (e.g. calling an external API).
As the classic logger operation, we can find the new logger scope in the palette:

To configure it, we need to provide:
- Name of the module configuration (global JSON Logger config name)
- Priority (same as standard logger)
- Scope specific tracepoints: DATA_TRANSFORM_SCOPE, OUTBOUND_REQUEST_SCOPE, FLOW_LOGIC_SCOPE
- Category (optional)
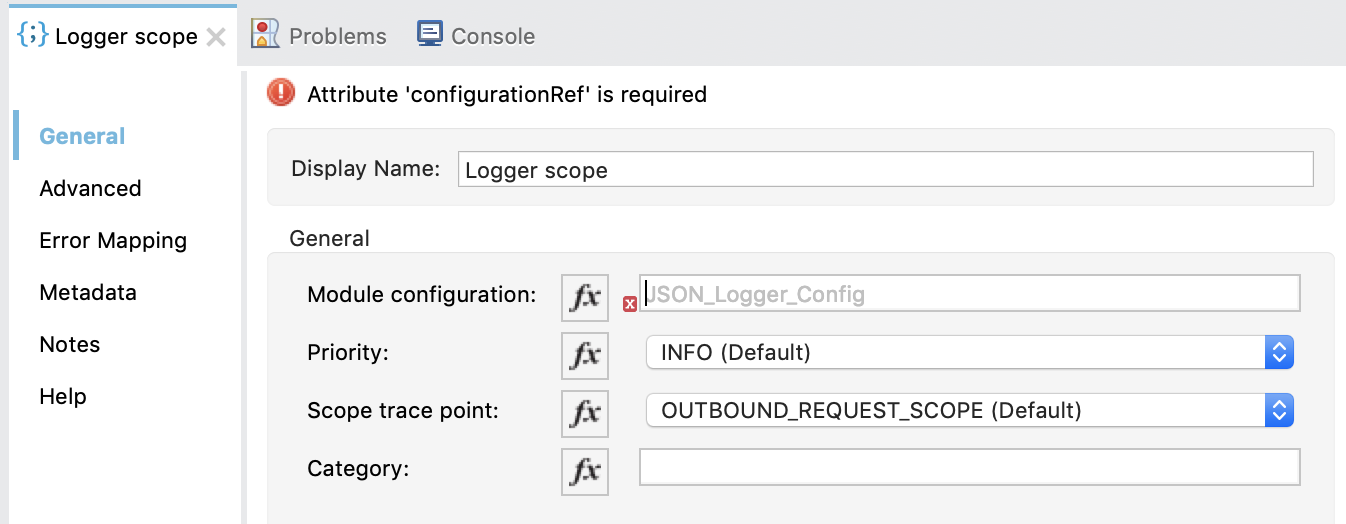
Note: Due to current limitations on the SDK, scope components can’t be associated in a “UX-friendly way” to a particular config, thus, you need to manually write the name of the config associated with the scope.
Ultimately, what the scope operation will do is:
- Print a log an entry before executing the operations inside the scope.
- Print a log entry after executing the operations inside the scope adding a scope specific elapsed time.
This is what the scope log entries would look like:

In this example, note that even though the selected tracepoint was “OUTBOUND_REQUEST_SCOPE” the logger will internally append “_BEFORE” and “_AFTER” to the tracepoints so that it’s easier to identify. However, selecting a particular tracepoint won’t affect the logger’s behavior.
Other improvements
Public jsonschema2pojo-mule-annotations
A big change from an operational perspective is that the jsonschema2pojo-mule-annotations extension, which helps generating Mule SDK specific annotations, has been published to Maven Central which means you no longer need to deploy this library to your own Maven repository (e.g. Exchange).
Field ordering
Lastly, there was a change in the order of the fields when the JSON output is printed which should particularly help customers running on CloudHub, where larger logs get truncated. With the new order, the content field (often the most extensive one data-wise) was pushed to the end of the structure so that important information is still readable.
Want to try it?
As usual, you can try the version deployed to my Exchange repository. However, if you do decide to leverage the logger for your production apps, I recommend:
- Fork the GitHub repository (so that you can have a copy of the source code).
- Deploy a copy of the logger to your own organization’s Exchange or Maven repository.
As mentioned above, since the jsonschema2pojo-mule-annotations is now hosted in Maven Central (publicly accessible Maven repository) the deployment script was simplified. All you need to do is:
- Configure settings.xml to include your Anypoint platform credentials pointing to a repository named “Exchange2” (this can’t be any name unless you edit the pom.xml).

- Run the script:

GitHub repository
Check out the GitHub repository for more information.
Support disclaimer
In case you haven’t noticed the type of license for the source code, this is provided as a side project under MIT open source license which means it won’t be officially supported by MuleSoft as it is considered a custom connector.


