
This is a sequel to my previous blog post about JSON logging for Mule 3. In this blogpost, I’ll touch upon the re-architected version of the JSON logger for our awesome Mule 4 release while leveraging the (just as awesome) SDK!
A word on the new SDK
Before diving into the new JSON logger for Mule 4, I’d like to acknowledge the impact of the new SDK on some of the core features offered in this release of the connector. If you ever had the need to write a custom connector with DevKit in Mule 3, then think of SDK as your “DevKit wishlist” come true. I really have no other way to explain how cool and powerful our new SDK is (and it had to be!) as it powers every single connector in Mule 4. Thus, the ability to leverage the same framework for all components resulted in standardization and the much more strongly typed system that Mule 4 is today.
So what’s new with JSON logger for Mule 4?
If you are here, I’m assuming two things:
- You already know about Mule 4’s new architecture and paradigms.
- You already read part 1 of this blog series.
If you did, then you will understand that the JSON logger connector had to be re-architected to keep the main tenet around customization through editing of JSON schemas (rather than having to fully understand the SDK innerworkings) and leverage all the new capabilities offered by the new SDK.
If you ever used JSON logger in Mule 3, then these are some of the coolest changes in this release:
1. Location Info (huge!!)
Ok, we are set on the right path to logging our way to a better (devops) life, but then an issue arises and we need to figure out where inside the Mule application certain things are happening. How do we figure out where in our extensive beautiful code lies the specific log entry we are looking for? After all, we have tons of logger components throughout the application.
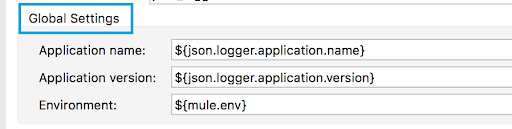
This was one of my top wish list items from the DevKit era and something I was desperate to incorporate on the Mule 3 version of the JSON logger – and guess what? In Mule 4 with SDK, it is now a reality! As per the docs, now SDK offers the ability to obtain context information for our operations and have access, for instance, to the Location object which basically gives you everything you want to know about where are you in your application. Given an image (or JSON) says more than a thousand words, this is what it looks like:
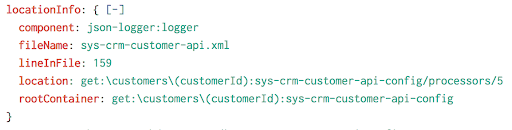
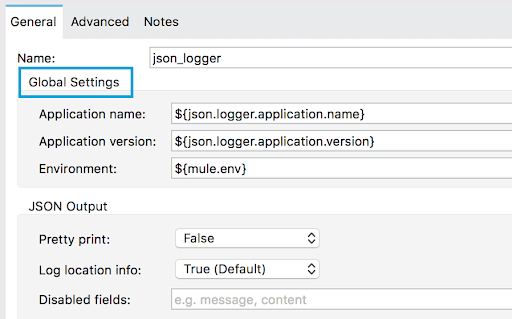
As you can see, critical troubleshooting information such as the name of the flow (rootContainer), name of the xml configuration file (fileName), and the exact line number where the logger is located (lineInFile) can now be part of the log metadata and configured through the global config element:
2. Disabled fields
A common request I’ve had ever since I published the first JSON logger was how to filter “sensitive” data, particularly in staging and production environments. After thinking about it for a long time, my answer is a combination of technology and development practices.
What I propose is decoupling how we log functional data (data that provides meaningful application state information without including sensitive data) vs. troubleshooting data (typically raw data coming in and out of different components). For this purpose, JSON logger provides two very distinct fields out-of-the-box:
- message: Field meant for meaningful non-sensitive functional messages such as “Request received from Customer with ID: 1234”
- content: Field meant for raw data typically useful during development and test phases (e.g. payload, attributes, vars, etc.)
If somehow we are able to point our development team to the right direction and have them log valuable non-sensitive data (a.k.a. PII or PCI data) in the message field, and any raw troubleshooting data into the content field, then we can leverage the “disabled fields” feature to filter certain log fields from being printed (e.g. content):

The above example will effectively tell the JSON logger that it needs to skip any field defined here (you can add many comma-separated fields, e.g. content, message, etc.). Taking this a step further, we could assign an environment variable (e.g. ${logger.disabled.fields}), which in lower environments could be null, but then on stage and production could be set to “content.”
As I mentioned, the approach is not bulletproof and requires having conscious developers adhere to certain best practices. But hey, better than nothing, I hope!
How to use it?
Just like its predecessor, the JSON logger for Mule 4 has been published to my own Exchange:
So for a quick test drive, you can get it using the same guest account as before:
User: guest-mule
Pass: Mulesoft1
However, if you truly want to leverage and/or customize the component, you should get the source code and install it on your own Exchange.
To make things much easier, in this release I’m also providing a deployment script as well as a template settings.xml maven configuration file.
1. Clone the repo
https://github.com/mulesoft-consulting/json-logger/tree/mule-4.x/json-logger
And make sure you switch to mule-4.x branch.
2. Configure your settings.xml
Inside the folder template-files/ there is a file called settings.xml which can be used as a reference to configure your maven settings.
Inside this file you need to replace the following values:
- CUSTOMER_EE_REPO_USER and CUSTOMER_EE_REPO_PASS are the credentials provided by Mulesoft Support for customers to access our private Nexus repositories
- ANYPOINT_PLATFORM_USER and ANYPOINT_PLATFORM_PASS are the credentials you normally use to login into our Anypoint Platform. Just make sure you have Exchange Contributor role granted.
Note: This assumes you already have have Maven 3.5+ installed.
3. Run the script: deploy.sh
Once you’ve done all the pre-work, all that is left is running the script under the base folder called deploy.sh and passing your Organization Id as an argument:
./deploy.sh
The script will basically run the command mvn clean deploy to deploy the following projects into your own Exchange:
- jsonschema2pojo-mule-annotations → this project generates all the SDK specific annotations once you build the JSON logger connector
- json-logger → is the actual JSON logger
4. Add the connector to your project from Exchange
Inside the folder template-files/ there is a file called settings.xml which can be used as a reference to configure your maven settings.
5. Best practices for the win!
Once you start playing with the connector, you will see the following configuration by default:

The default properties assumed for those would be:
### JSON Logger configuration ###

# Indicate which fields should not be logged
json.logger.disabledFields=

# [DO NOT EDIT] To be replaced by Maven build
json.logger.application.name=${project.artifactId}
json.logger.application.version=${project.version}
The rationale behind this is:
a. Your maven pom.xml file already has an:
- Artifact Name: Equivalent to your application name
- Artifact Id: Equivalent to your application version
Assuming you are following good SDLC practices, the chances are you are already maintaining your pom.xml thus, hard-coding or defining those exact same values elsewhere makes no sense. The recommended way to do it is by having your properties point to the pom.xml properties generated during build time leveraging something called “resource filtering.” In order to enable this, the <build> snippet inside your pom.xml should look like:
            ${basedir}/src/main/app
            true


            ${basedir}/src/main/resources
            true


            org.mule.tools.maven
            mule-maven-plugin
            ${mule.maven.plugin.version}
            true

                true
b. While disabledFields doesn’t have a default value pointing to an environment variable, it might be a good idea to have it doing so (e.g. json.logger.disabledFields) so that you can alter the logging behavior at runtime.
c. mule.env is an environment variable you should always aim to have by default (configured at the runtime level) so that you can easily tell which environment your application is running on.
Ok but how do I really, really USE it?
As promised in my previous article, in this post I will also show some basic reporting use cases leveraging Splunk because, let’s admit it, everyone likes nicely colored charts. You can find the source code for all the dashboards below under: /template-files/splunk.
Note: A huge thanks to one of our brilliant Solutions Architect’s Rahul Dureja for giving me a bunch of dashboard ideas and a crash course on Splunk SPL 🙂
Search: Out-of-the-box indexing
Well… this is it! The very reason why we are doing this in the first place. Brilliant data aggregation platforms like Splunk can easily understand our JSON data structures, index the fields within and ultimately empower us to create extremely useful dashboards as well as providing advanced searching capabilities.

As you can see, without any customizations, Splunk is already smart enough not only to index the main fields (shown in red) but also pretty prints the content field which contained a “stringified JSON”.
Dashboard: Data visualization
One of the most common requirements, particularly for DevOps, is to be able to monitor your API response times and number of transactions. The following dashboards can help with that:
- Response times
Code:
Customer 360 Process API host="splunk-json-logger.localtunnel.me" environment=$env$ applicationName=proc-customer360-api tracePoint=END | stats avg(elapsed) as elapsed min(elapsed) as min max(elapsed) as max | gauge elapsed 0 250 450 650 $timestamp.earliest$ $timestamp.latest$ 5s delay
Dashboard:

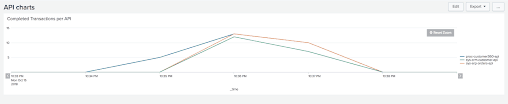
- Number of transactions
Code:
Completed Transactions per API host="splunk-json-logger.localtunnel.me" environment=dev tracePoint=END | timechart span=1m count by applicationName -1d@d @d
Dashboard:
Dashboard: API Summary
Another great way to leverage the rich metadata we now have available, such as tracePoints, correlationIds, and locationInfo, is by creating advanced summary dashboards that can provide in-depth analytics such as:
- API Calls per Resource
- Recent 5 Successful Transactions
- Recent 5 Failed Transactions
- Unique Messages Received
- Number of Successful Calls
- Number of Errors
- All API Transactions

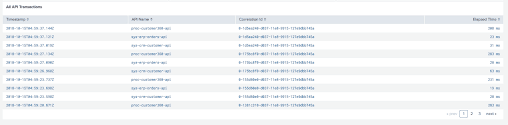
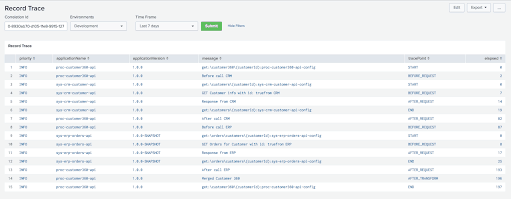
Dashboard: Record Trace
Another common requirement might be to see all the events related to a specific transaction end-to-end. This dashboard allows a table visualization of all the events associated to a specific correlationId.
Code:
Record Trace host="splunk-json-logger.localtunnel.me" environment=$env$ correlationId=$correlationId$ | sort by timestamp | fields - _* | fields + priority applicationName applicationVersion message tracePoint elapsed $timestamp.earliest$ $timestamp.latest$
Dashboard:
But how do I get data into Splunk?
I’m by no means a Splunk expert (not even novice for that matter), but just to get you started, these are the two typical scenarios, depending on your Mule deployment architecture:
On-premises runtimes
When you have control over your servers, Splunk recommends the use of forwarders. Basically it only takes a one-time configuration on the servers for the logs to be forwarded to Splunk, and aside from the server configuration, the operation is non-intrusive from the Mule applications perspective.
CloudHub
This scenario is a bit trickier as we don’t have control over the cloud workers which renders the forwarder useless. However, another common mechanism available to send logs to Splunk (for Java applications) is through the Splunk Log4j Appender (which internally leverages Splunk HEC).
As soon as we explore this option we hit the immediate next roadblock, which is the way CloudHub, by default, overrides the application’s specific Log4j configuration and replaces it with its own.
Luckily, for such scenarios there is a feature called “Custom Log Appender” (disabled by default) that can be enabled by opening a support ticket on the customer portal.
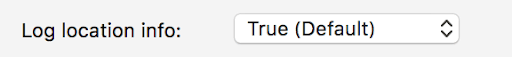
Once we have the feature enabled, we need to mark the checkbox:
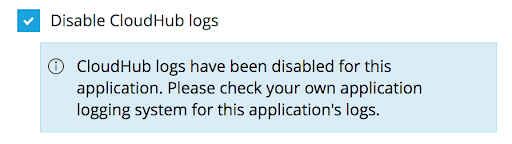
This tells CloudHub to leverage the log4j2.xml configuration provided with the app instead of replacing it with its own CloudHub configuration.
Note: Even though the message says “CloudHub logs have been disabled,” we still have the ability not only to publish log events to our own Splunk instance but also keep sending them to CloudHub default logging infrastructure (either as a backup or until we fully transition to Splunk).
Lastly, to help you jump start, I’m also providing a very basic log4j2.xml example that forwards logs both to CloudHub and Splunk. In order for this to work we have to:
1. Provide splunk.server environment variable with the Splunk server information.
2. Replace YOUR_SPLUNK_TOKEN with your own provisioned Splunk HTTP Event collector token (granted this should probably be an environment variable as well, but you get the idea).
3. Add the Splunk Log4j appender dependency to your Mule application:
   com.splunk.logging
   splunk-library-javalogging
   1.6.0
4. Add the Splunk Repository:
   splunk
   splunk-releases
   http://splunk.jfrog.io/splunk/ext-releases-local
How to customize it?
Like its predecessor in Mule 3, the whole rationale behind JSON logger is to be a customizable component through metadata changes in the provided JSON schemas without having to really know much about SDK itself.
In order to customize the JSON output data structure, we pretty much follow the same concepts as described here. However, using the annotations described below, a big change introduced on this version is that for global expressions, we no longer need define the field in both the loggerConfig.json and loggerProcessor.json. Instead, everything defined at the config level that we want to be printed in the output logs needs to be part of the nested object globalSettings inside loggerConfig.json.
Gotcha: If you define expressions inside the global config, make sure that the result of these expressions are fairly static throughout the lifecycle of the Mule app at runtime (e.g. appName, appVersion, environment). If you define something dynamic like “correlationId” (which, in theory, changes per request) then SDK will create a new instance of the global config for every new value which will end up in memory leaks.
Supported configurations
In order to tell the JSON logger how each field should be treated, we need to use the “sdk” object. Inside this object we can use the following attributes:
- default → As the name implies, it allows to define a default value. It also implicitly makes the field optional, so it doesn’t require the user to input a value.
Code:
"priority": {
   "type": "string",
   "javaType": "org.mule.extension.jsonlogger.api.pojos.Priority",
   "enum": [
      "DEBUG",
      "TRACE",
      "INFO",
      "WARN",
      "ERROR"
   ],
   "sdk": {
      "default": "INFO",
      "summary": "Logger priority"
   }
}
Preview:

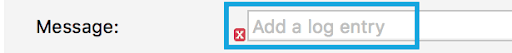
- required + example → Unless specified, all fields are considered “mandatory.” You can also explicitly mark a field as required == true. When having a required field, it’s very helpful to provide an example text that points developers to the required data.
Code:
"message": {
   "type": "string",
   "sdk": {
      "example": "Add a log entry",
      "required": true,
      "summary": "Message to be logged"
   }
}
Preview:
- displayName → Specifies the name to be displayed in the Studio/flow designer UI.
Preview:

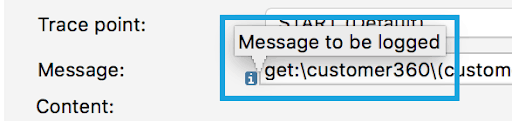
- summary → Provides information about how to populate/use a specific field.
Code:
"message": {
   "type": "string",
   "sdk": {
      "example": "Add a log entry",
      "required": true,
      "summary": "Message to be logged"
   }
}
Preview:
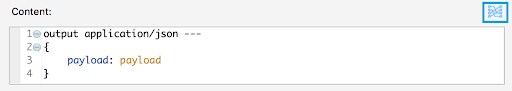
- isContent → For scenarios when we need to log more complex data (e.g. based on expressions, payloads, attributes, etc.), we have the ability to define the isContent attribute to indicate SDK that the input will be a full fledged Dataweave expression. Finally, JSON logger will internally attempt to “stringify” the results of the expression and log it as part of the JSON object.
Code:
"content": {
   "type": "string",
   "javaType": "org.mule.runtime.extension.api.runtime.parameter.ParameterResolver>",
   "sdk": {
      "default": "#[output application/json ---n{n tpayload: payload,n tattributes: attributesn}]",
      "summary": "Remove if no content should be logged",
      "isContent": true
   }
}
Preview:
- isPrimaryContent → This option only exists for scenarios where you need more than one content field, as SDK needs to be told which field should be the primary one.
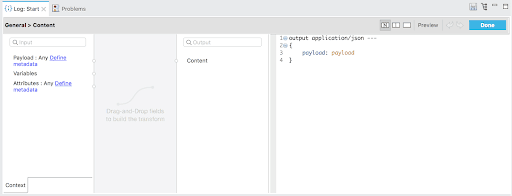
- expressionSupport (NOT_SUPPORTED / SUPPORTED / REQUIRED) → This field controls how the UI is generated for a specific field or object, e.g. if we want fields to be shown explicitly in the UI, we need to set the value to NOT_SUPPORTED.
Code:
"globalSettings": {
   "type": "object",
   "properties": {
      "applicationName": {
         "type": "string",
         "sdk": {
            "default": "${json.logger.application.name}"
         }
      },
      (...),
      "sdk": {
         "parameterGroup": "Global Settings",
         "expressionSupport": "NOT_SUPPORTED",
         "placement": {
         "order": 1
      }
   }
}
Preview:
- placement → In SDK, there are two ways to organize where things are displayed:
- order → Indicates in which order fields will be displayed
Code:
"globalSettings": {
   "type": "object",
   "properties": {
      "applicationName": {
         "type": "string",
         "sdk": {
            "default": "${json.logger.application.name}"
         }
      },
      (...),
      "sdk": {
         "parameterGroup": "Global Settings",
         "expressionSupport": "NOT_SUPPORTED",
         "placement": {
         "order": 1
      }
   }
}
Preview:
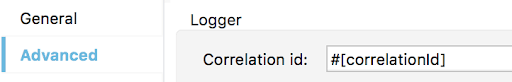
- tab → Allows to display fields in different tabs.
Code:
"correlationId": {
   "type": "string",
   "sdk": {
      "default": "#[correlationId]",
      "placement": {
         "tab": "Advanced"
      }
   }
}
Preview:
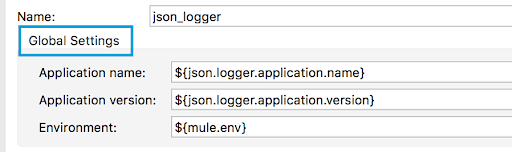
- parameterGroup → Allows to visually group a set of related fields.
Code:
"globalSettings": {
   "type": "object",
   "properties": {
      "applicationName": {
         "type": "string",
         "sdk": {
            "default": "${json.logger.application.name}"
         }
      },
      (...),
      "sdk": {
         "parameterGroup": "Global Settings",
         "expressionSupport": "NOT_SUPPORTED",
         "placement": {
         "order": 1
      }
   }
}
Preview:
The end?
See the latest updates on the JSON Logger by checking out this blog.
I always welcome feedback and feature requests, but I hope the current state will help you jump start on the wonders of Mule 4 and JSON logging!
GitHub Repository
Check out the GitHub repository for more information.


