With the advent of microservices, the functionalities that used to be bundled together in a single web/mule application are now running on different containers across VMs and at times across datacenters. This presents a huge challenge to trace transactions as they traverse across the container/VM boundaries.
To address this challenge, companies build a custom distributed tracing solution, which is expensive, time-consuming, and creates maintenance challenges. Several open-source initiatives have been created to solve this from Apache Foundation, CNCF, and others which comply with OpenTracing industry standard. Although conceptually they all work the same way, there are some nuances in their implementations. Some are written in Java for versatility, and others in GO for speed. Some of the popular frameworks are Zipkin, Jaeger, and Hawkular.
Benefits of distributed tracing
Distributed tracing provides the following benefits:
- Distributed context propagation
- Distributed transaction monitoring
- Root cause analysis
- Service dependency analysis
- Performance/latency optimization
How is this different from log-based tracing?
Companies that have invested heavily in log aggregation and visualization platforms often use log-message-based tracing. The difference between this and OpenTracing is that log-based tracing is reactive and there is a significant time gap between when an event occurs to the time it is reflected on the dashboard. OpenTracing provides real-time tracing.
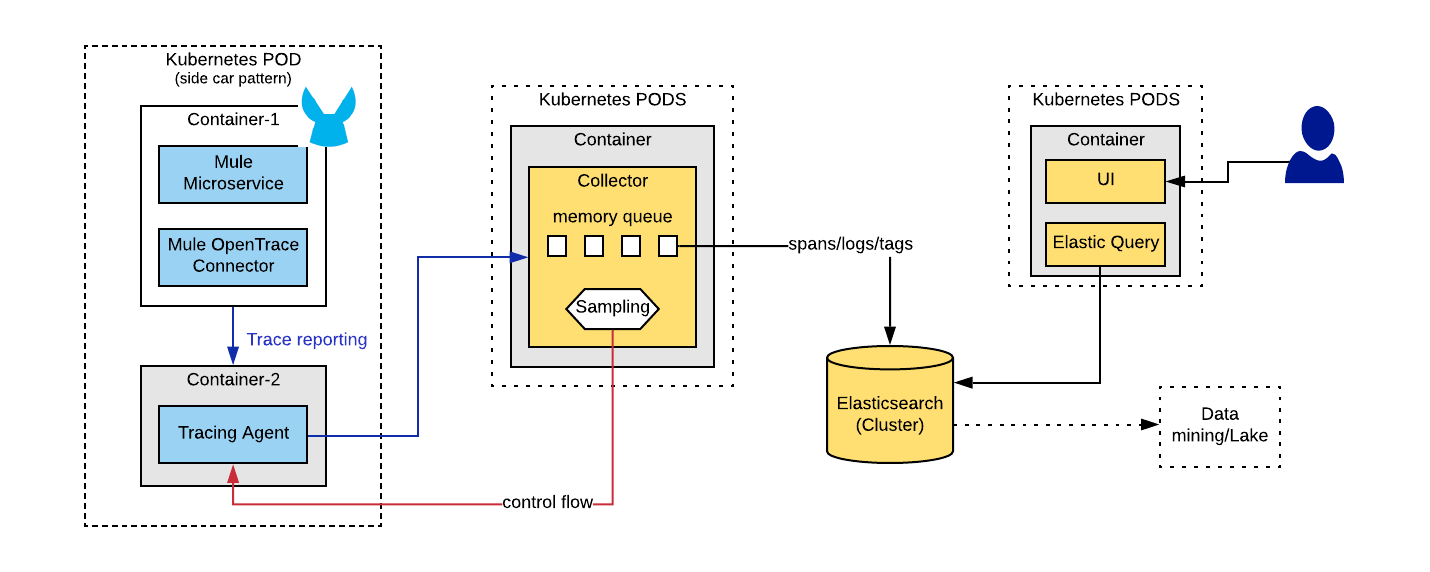
OpenTracing framework: Logical diagram

The above diagram can be summarized into two primary categories of components: client-side components and server-side components.
Client-side components
- OpenTrace client
- A connector or a helper service that captures traces and/or spans and sends those events to an agent.
- User will use OpenTrace API methods like begin, end, inject, extract, tag, and log to create tracing events
- OpenTrace Agent
- This is typically co-located along with your microservices to achieve optimal performance benefits.
- Collects trace events from OpenTrace clients and delivers those messages to a collector in near real-time.
Server-side components
- Collector
- This is a high throughput in-memory queue.
- As the name indicates, it collects the messages/events from the agent and delivers them to the Cassandra/ElasticSearch database.
- It throttles the incoming messages from multiple collectors and delivers them to the database.
- When the incoming message volume is higher than the processing capacity of DB, it reduces the sampling frequency.
- ElasticSearch Database
- The NOSQL database stores the events for processing by OpenTrace query system.
- You can use Cassandra database instead of ElasticSearch.
- Query system
- This queries the NOSQL database and provides the data to UI for rendering.
- UI
- UI displays the tracing data.
Implementing distributed tracing for Mule microservices
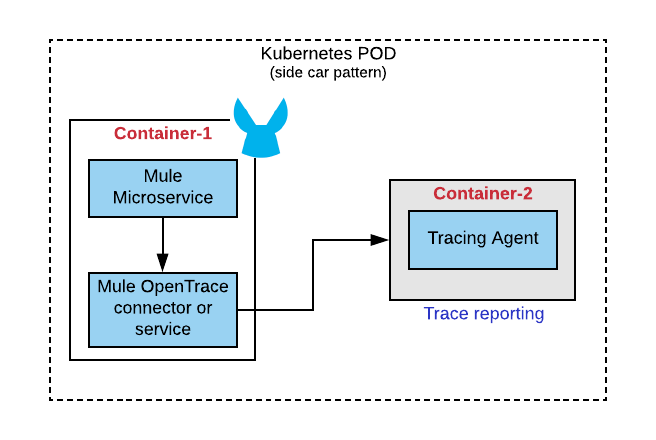
Mule-specific changes are involved primarily on the client-side. We use the sidecar pattern to implement tracing for Mule microservices, where we bundle two Docker containers in the same pod. One of those is the Mule microservice which creates the trace, span events and the other is an assistive container that actually intercepts and delegates those events into tracing collector.

Things to consider:
- As an API or a microservices developer, you could create an Opentrace helper service or a Mule connector, which will be invoked at strategic steps to create traces and spans. Our recommendation is to create the connector due to its portability.
- Include logic to identify whether a microservice is the initiator or a joinee for a trace. Based on that, you would need to create a new trace or join an existing trace. This is important as your transactions span across HTTP boundaries.
- Although primarily used with HTTP/s protocol, Opentracing can also be used with JMS. This can be leveraged for many use cases as this expands your transaction boundary.
Want to explore more?
I will be writing a couple more articles on this focusing on:
- Nuances of tracing concepts
- How to build your own Mule OpenTracing connector
- How to set up a production-grade distributed tracing framework
- An end-to-end implementation
For more developer resources, check out the tutorials section of our website. Reach out to me with your feedback in the comments section or on LinkedIn


