
Distributed tracing has the potential to shift the paradigm within monitoring and observability. So why does it continue to lack mainstream adoption?
Despite holding the number two spot in the Cloud Native Computing Foundation’s portfolio – right behind Kubernetes, a technology that’s barreling towards omnipresence across the IT industry – businesses attempting to integrate distributed tracing into their core observability strategy are few and far between.
This wasn’t always the case. When the project gained traction circa 2017, there was an enormous amount of buzz . So what happened?
In short, distributed tracing is a technology with certain barriers to entry , and these barriers make adoption prohibitive for complex micro-architectures. This reality somewhat derailed the project’s transition from hyped concept to mainstream adoption.
The tide is once again turning, though, thanks in large part to a broader paradigm shift affecting the global technology industry : the advent of AI. Every aspect of IT is being revolutionized and monitoring is no exception.
Before getting into exactly how AI is poised to impact the realm of observability, we’d like to set the foundations for this topic by defining what distributed tracing actually is, why it’s important, and what problem it intends to solve.
What is distributed tracing?
Distributed tracing is best illustrated via a plumbing analogy.
Think of your technology stack as a pipe network, with the ingress of data representing water as it flows around the system. Now imagine your e-commerce system stops working, the equivalent of a pipe rupturing. The metrics swing red and errors pour out of the logs.

Distributed tracing is like adding dye to the water; it allows you to understand how data flows across the system in a holistic sense. This gives you a better understanding of the network as a whole , including where the bottlenecks are forming and how they can cascade into a system rupture.
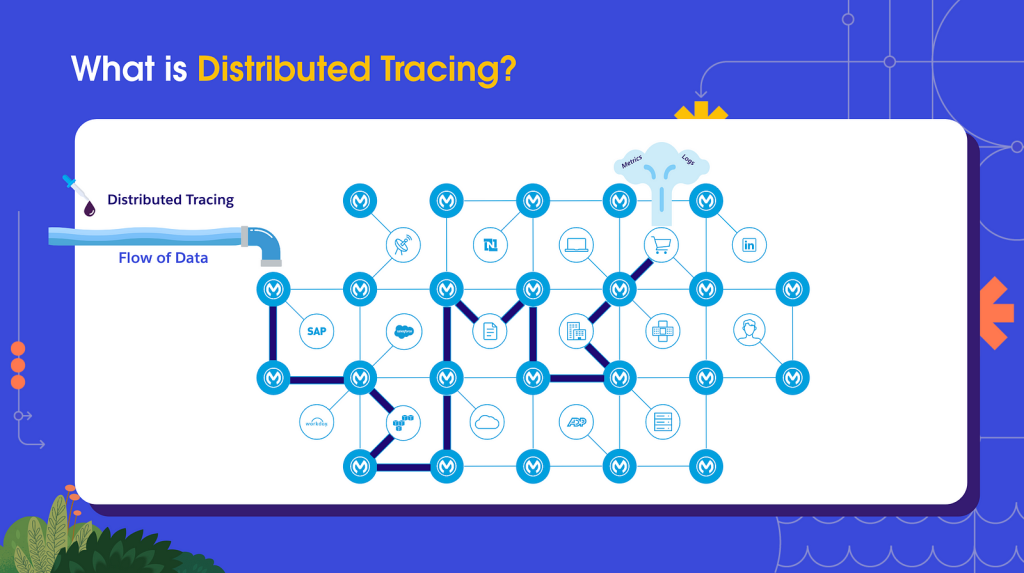
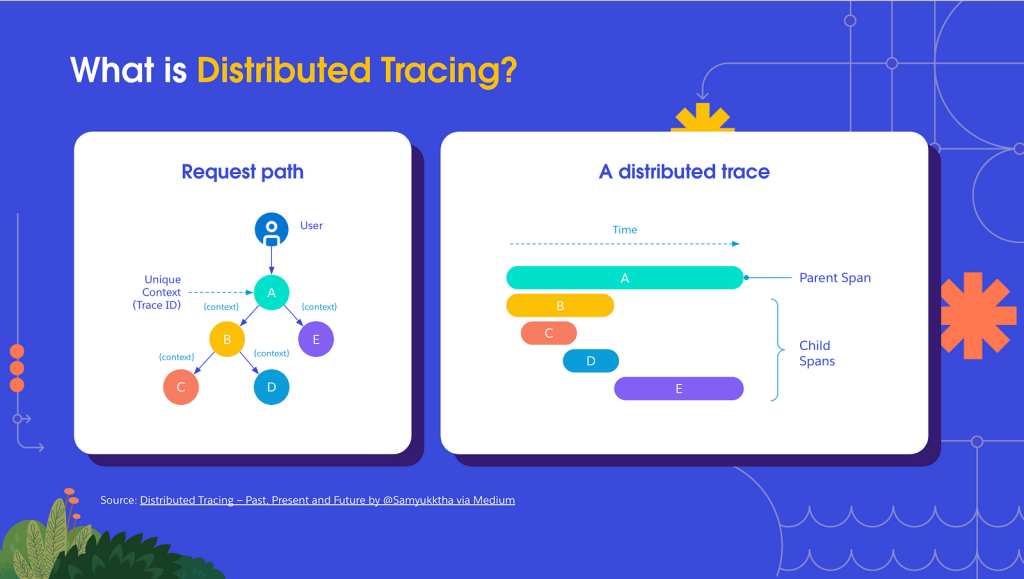
In reality, distributed tracing is the practice of appending a tracker to the header of every request that moves across your application network. This header is proliferated from app to app; it’s maintained as metadata at every stop and for the request as a whole . T his is what we refer to as a distributed trace.
Why is distributed tracing important?
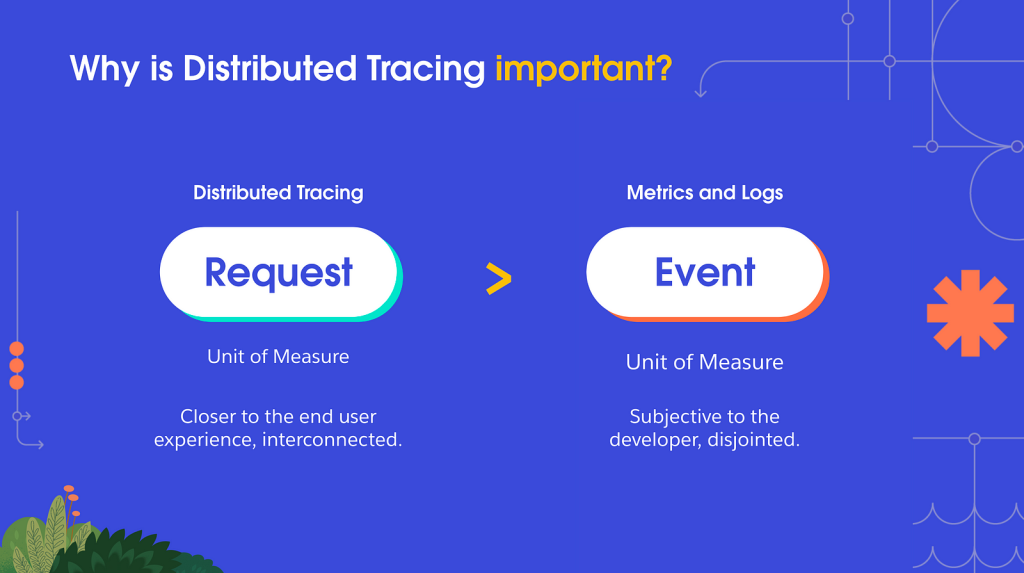
The paradigm shift distributed tracing represents begins to manifest when you accept this: Using a request as the unit of measure when evaluating network health is inherently more valuable than relying on events.
Event evaluation is driven by metrics and logs, and these are subjective tools; get five executives in a room and ask them what the metrics say, and they’ll give you five different answers – all of which coincidentally shift the blame away from their department. Logs can be subjective too as they’re written by individual developers and their root meaning can be just as hotly debated among engineers.
More often than not, they’re also disjointedly tied to a subset of applications; this makes it hard to see the forest for the trees when you’re plotting strategic decisions to try and improve your application architecture.
By indexing around a request instead, you get much closer to the actual end user experience with an interconnected view of how a request interacts and progresses through your entire network of applications.
Even so, event driven incident tools such as logs and metrics are still the dominant force in the observability industry. Logs and metrics have been around a lot longer than tracing, which explains their dominance to a degree.
But there’s been an industry shift that’s led to an over-indexing around metrics as a catchall tool for technical challenges. Personally? I blame DORA.

No, not that DORA – the DevOps Research & Assessment group…even though it’s not really their fault.

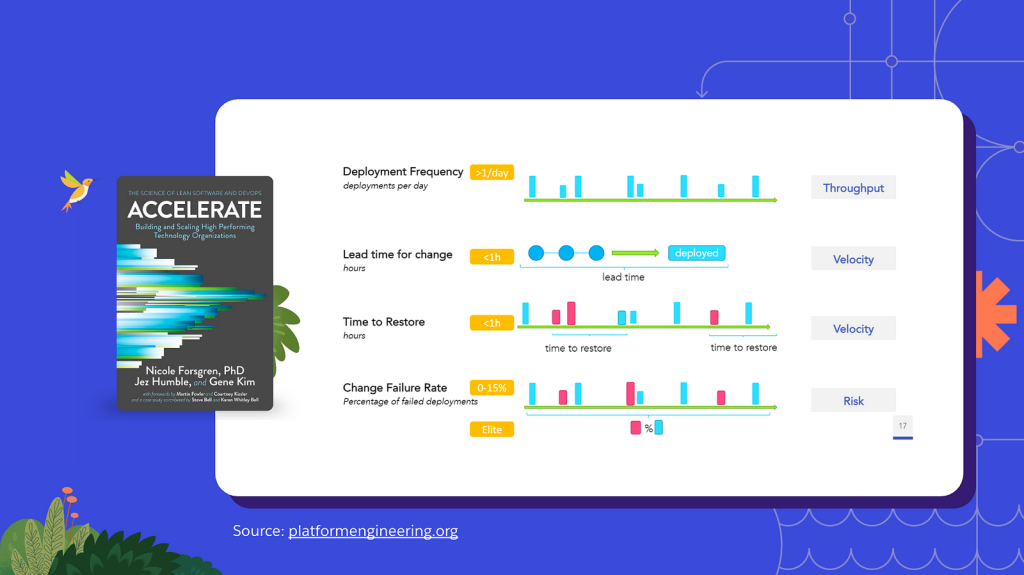
A few members of the DORA research group authored a seminal work within the field of DevOps: Accelerate.
This text kick started the modern DevOps revolution. It outlined four core metrics to evaluate a successful DevOps process: Deployment frequency, lead time for change, time to restore, and change failure rate . These metrics are now collectively known as the DORA metrics.
When something as complex as DevOps gets reduced to an easily digestible set of measurements, without fail the industry rallies behind the concept; everyone wants to buy into a secret formula that demystifies and distills complexity into a set of metrics.
And not to take anything away from DORA or Accelerate; it’s seminal research for a reason. But implementing DevOps is not easy. Tracking four metrics isn’t going to change that fact. It’s unfortunate, then, that because of frameworks like the DORA metrics, this attitude of indexing around metrics has become so pervasive.
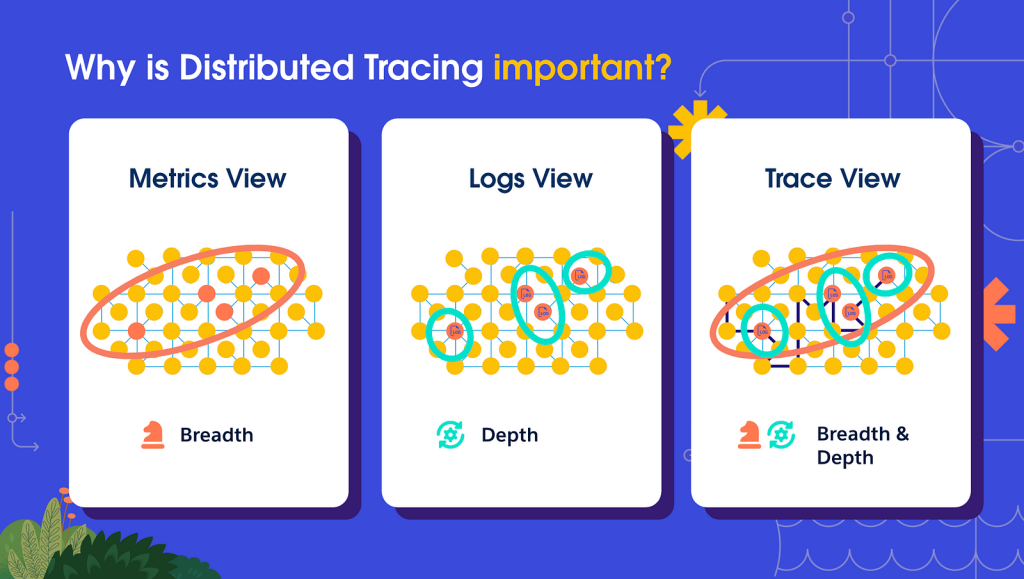
The issue with this approach is that it only provides a broad-stroke snapshot of performance. A metrics view is relevant to the operational processes that feed into your strategic goals, but it lacks the technical depth required for true root problem analysis.
Logs are the inverse. They provide the necessary technical depth to troubleshoot, but the insight they provide can be rather easily siloed within a specific subset of applications without the breadth of context that metrics provide that can influence your overarching monitoring strategy.
The true power of tracing is that it provides an additional context layer on top of these approaches, marrying the technical depth of logs with the strategic understanding of metrics to create a much richer view.
With this understanding in mind, we can now answer what distributed tracing solves.
What problem does distributed tracing solve?
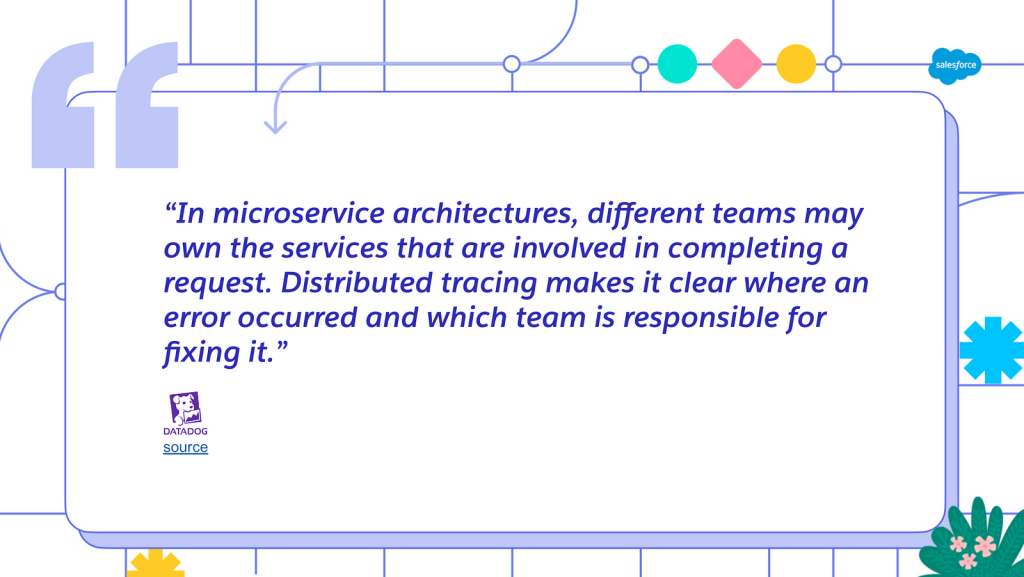
Ask any developer what the most painful moments in their life are and they’ll talk about time spent debugging a Sev-1 error in production with what seemed like a few hundred people breathing down their neck.
– Samyukktha
This quote summarizes the problem that distributed tracing tackles. When something goes really wrong, a Sev-1 wrong, the only thing that matters is how quickly you can resolve the issue.
The traditional model of either “check the logs and then use the metrics to figure out how broad the problem is” or “the metrics are going red, go check the logs and find out which apps are breaking” leaves out some pretty important context; namely, where the issue is stemming from and who’s best suited to fix it.
The context layer that distributed tracing adds is the ability to scan your entire application network and immediately understand the nuance of the issue; you can then follow standard procedure and use logs and metrics more pointedly to monitor and solve any issues. When the dust settles, you can examine your network holistically and decide how to implement operational or strategic process change in order to stop such issues from recurring.
As more businesses mature in their digital journey, a tool that offers this degree of observability becomes incredibly important. Modern application networks are becoming exponentially complex due to the sheer scale and technical nuance involved in linking together so many applications. Take this example below – a visualization of the 1600 micro-services utilized by Monzo, a UK-based bank:
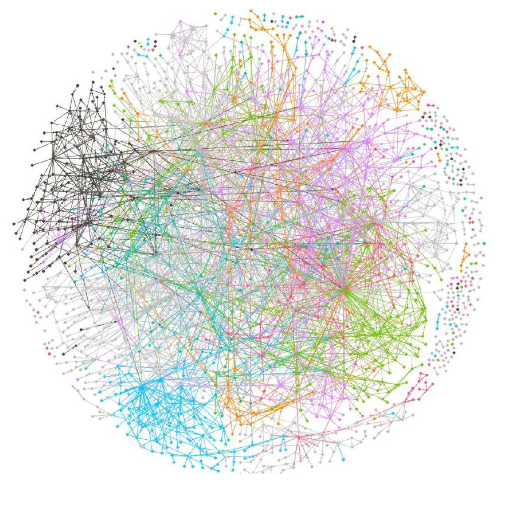
When your application architecture looks like this, traditional monitoring and observability practices need to be re-evaluated . Is it any wonder that 73% of companies are reporting that their mean-time-to-restore service is greater than an hour?
At this point, you might be asking: “If distributed tracing is so great, why isn’t this technology seeing widespread use?” That’s because it isn’t all sunshine and rainbows. Tracing has its own challenges, and these challenges create a barrier to entry that can often seem insurmountable for those that want to get started.
Barriers to adopting distributed tracing ( and how AI will remove them)
As a note, unless specified, the topics discussed in this section are not on MuleSoft’s roadmap; rather, the following is speculation as to the direction the technology may be heading.
The configuration issue
The biggest challenge IT teams that want to get started with distributed tracing face is setting up their application network to parse traces. This is easier said than done when application architectures such as the Monzo example above are becoming the norm.
Distributed tracing can’t be done in half-measures; the value is the holistic view, so setting up only a few apps to handle the trace metadata defeats the point. The IT investment required to get tracing setup can be extreme when you’re running a complex architecture, which is a real deterrent for the technology.
Starting with a subset group of applications is a solution, but with distributed tracing, the true value is derived from the economies of scale your whole application network represents.
This isn’t an issue if you deploy your applications on MuleSoft’s CloudHub 2.0 or Runtime Fabric. We’ve already done the heavy lifting setup-wise, so the moment you deploy an app on either platform, it’ll be immediately configured to parse trace data. So if you want advice, best practice is to run everything via MuleSoft.
We know IT teams have a diverse set of applications spread across a variety of different systems. There’s a solution on the horizon for you too: auto-instrumentation tools. These are lightweight agents that can be deployed into your app network and move from node to node performing the configuration work for you. OpenTelemetry already offers a rudimentary version of such a tool, and it’s not unforeseeable that with the augmentation of AI, these agents will almost entirely eliminate this large investment barrier for distributed tracing.
The sampling issue
Modern network applications consist of hundreds, if not thousands, of technologies which all communicate with each other in a more or less constant fashion. That adds up to a lot of requests; sampling is currently a necessary evil for distributed tracing to negate serious performance and storage requirements.
Industry standards dictate a range of 10–15% of all requests be traced. You then analyze that sample, determine your so-called “traces of interest” and use these as the basis of your monitoring and observability practices.
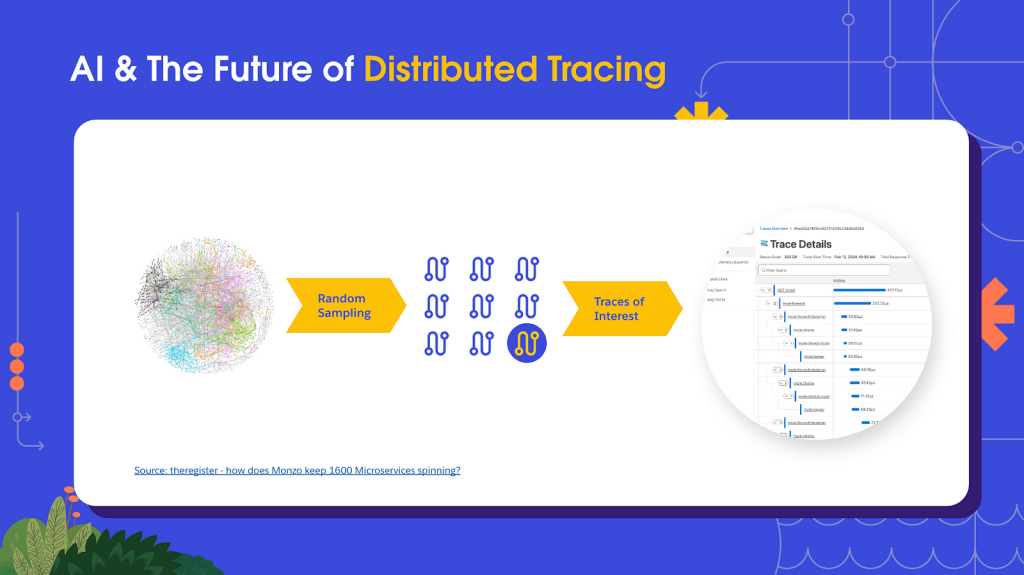
To reiterate, the value of distributed tracing derives from economies of scale in having as complete a picture as possible. Sampling reduces that picture and thus devalues the practice of tracing.
If you think about it, there’s almost no need to store 99% of traces. The only traces that are valuable are the ones attached to requests where issues are occurring. Unfortunately, such traces are the proverbial needle in a haystack of requests.
If only there was a cutting-edge, widely popular technology purpose built for large data models…
Of course, I’m alluding to large language models (LLMs).
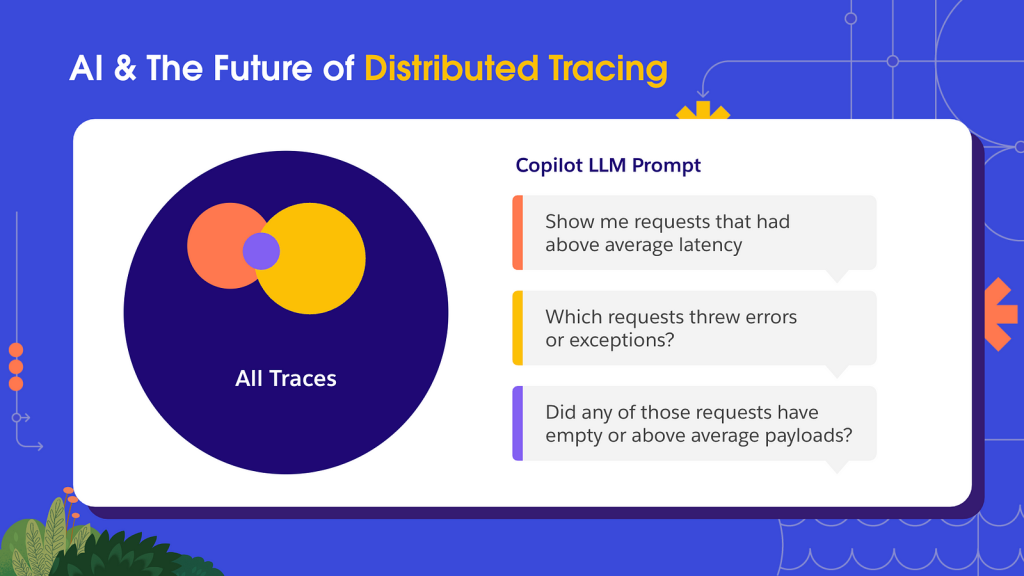
LLMs are the perfect tool for combining large datasets. If one were to be configured to work with trace data, you could use natural language to examine specific queries of interest. In the example illustrated below, a developer troubleshooting an error could poll an LLM to understand which queries had above-average latency, which threw errors and then narrow in on the intersection of that set to pinpoint the exact traces required for root-cause analysis.
Needless to say, the impact of such a tool for developers trying to fix any SEV-1 errors in a hurry would be immense. With the current rate of LLM advancement, this functionality should be available in the next decade or so.
The trace enrichment issue
Storing the status parameters of every request as they move between each application in your network can create an inordinate amount of storage strain. As such, the current parameters stored by each trace tends to be limited, usually encompassing latency and exception data alongside details of the request payload.
The power of distributed tracing is directly correlated to how vividly a trace can paint a picture of your application network. The more data available in the trace, the more accurate it can reflect reality.
What if traces could be composed of every data field required for root-problem analysis: logs, metrics, events, states, you name it . This would make traces are the ultimate debugging tool. It isn’t possible right now, but it’s fast entering the realm of possibility.
AI and observability
Much as a trace does, I’d like to take a moment to paint you a picture – one of a not too distant future.
You’re an IT Ops admin who wants to configure your company’s network of 2000+ applications to parse a trace in the header of each request (this would already be done if all your apps were deployed in MuleSoft, just saying).
You spend maybe 30 minutes setting up your auto-instrumentation tooling, which then deploys an agent that completes the config in a matter of hours. Your IT org can now start pinning enriched trace headers to every single request being transmitted across your technology stack – capturing the logs, metrics, events, states, payload details, and latency at every step.
The phone rings – it’s the VP of Sales. She says the current platform stability is jeopardizing millions in ARR. “Don’t sweat it,” you say, as you begin to boot up your observability copilot and start plying it with questions about system performance, the apps involved, and the responsible teams. It sends you back a list of the affected services and who to involve , and it also asks if you’d like to automatically create a tiger team on Slack to fix the issue.
“Yes. Yes I would.” you think to yourself as you click a button that spins up a Slack channel that pulls in the involved parties and generates a text guide detailing the required fix.
You get a full eight hours of sleep. Your company closes the deal. Everybody is happy.
In this utopian future, the technology I outlined is essentially all a developer would ever need to debug any software issue.
Distributed tracing is the axis around which this reality is being built. So why not get started today?


