
When it comes to the integration space, monitoring can often appear to be an afterthought.
The narrative tends to skew towards the business value of the integrations themselves, rather than the infrastructure powering them. The observability tools packaged into some integration platforms reflect this – usually in the form of a token dashboard that offers a lightweight view of the requests moving across your application network, with little nuanced insight or customization options available to help you understand a realistic picture of your system health.
The approach we’ve adopted at MuleSoft is a little different.
We believe that health monitoring and application observability are as critical a part of any enterprise integration as the integration itself. Business-critical apps can only provide value if the infrastructure supporting them is performant. You need the tools to proactively address any bottlenecks or issues; without them, the value you’re striving towards by connecting applications to begin with will be negated by poor service.
That’s why we developed our core monitoring product, Anypoint Monitoring, to provide rich insight and customizable flexibility so our users can keep a handle on their increasingly complex application networks.
As these networks continue to expand, the remit of monitoring and observability grows too. Our ethos orients this remit around three central pillars:
- Insightfulness: Monitoring can’t be done in half-measures, with low calorie dashboards. The insight surfaced needs to be rich in context and actionable in order to impact strategic system health.
- Comprehensiveness: From the initial API deployment through to application scaling, there shouldn’t be a single black box; you should always have some way to understand performance at every step of the journey.
- Extensibility: Monitoring and observability is a huge ecosystem and the tools here work best when they work together. MuleSoft offers full-fledged monitoring capability in its own right, but we also want to partner with the providers in this place so our customers can adopt a robust, hybrid approach to observability.
With these tenets in mind, we’ve doubled down on our investment in the monitoring and observability space, with a host of new and upcoming features available that cover the entire API and integration lifecycle, which will be detailed below.
Deployments: API Insights (GA: Q3, 2024)
As modern IT teams are expected to forge tech stacks that contain hundreds, if not thousands, of interconnected applications, defining a comprehensive API Management approach can prove an unwieldy challenge. Having a centralized place to deploy, manage, and monitor your API resources is one of the most succinct strategies to address this.
Securing sensitive APIs and taking action to ensure proper governance is also paramount, as the scale of growth can result in vulnerabilities slipping through the cracks without proper oversight.
That’s why we’re happy to announce the upcoming Q3 release for our Anypoint Platform, API Insights.
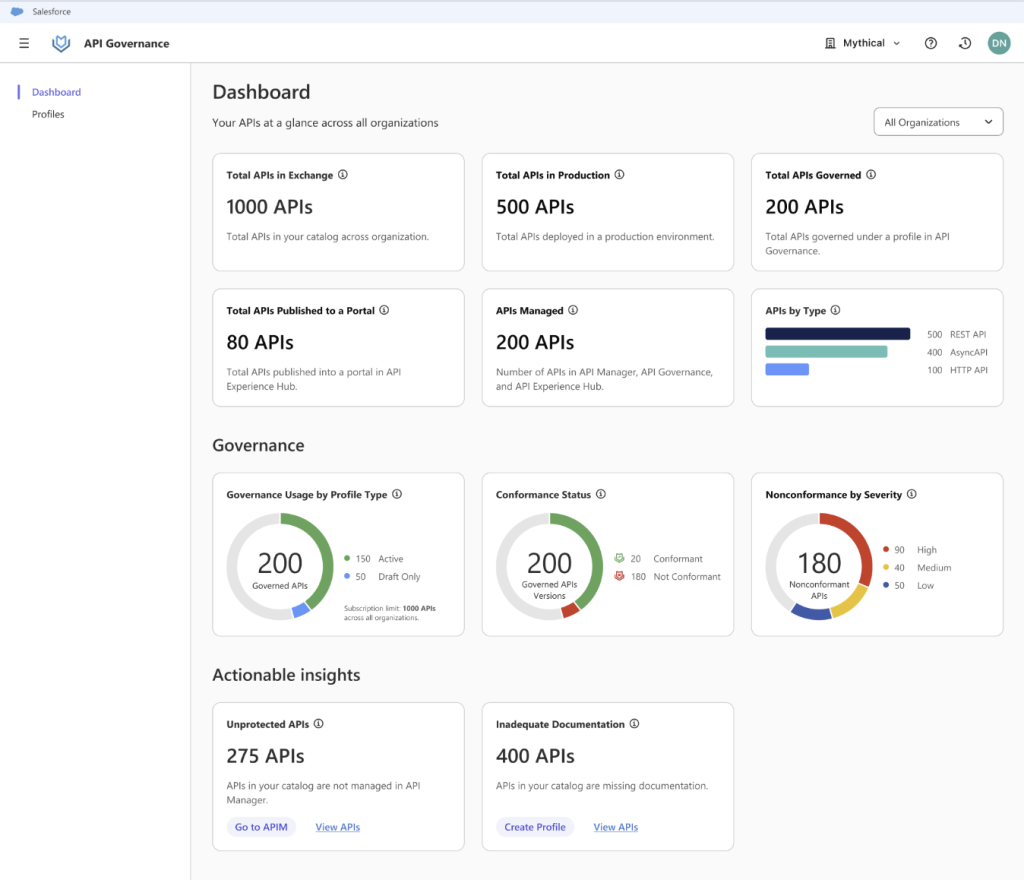
API Insights, a new out-of-box dashboard included with Anypoint platform, will provide dashboard analytics that enable you to improve your API posture through surfacing analytics regarding various aspects of your organization’s API lifecycle.
You’ll be able to quickly understand your API footprint, both within MuleSoft and across different systems like AWS or Azure. Validate which of your APIs are governed or non-conformant to your policies, all while keeping tabs on which APIs are public or sensitive, unsecured or unprotected, and even which ones are missing documentation.
Architectural: Anypoint Visualizer
Implementing an APIM strategy is step one, and being able to ensure API posture and set the ground rules for policy adherence is a great start to staying ahead of any issues and bottlenecks occurring across your integration and API life cycle. But it’s also important to drill deeper and understand your application network connections on a more granular level. Enter Anypoint Visualizer.
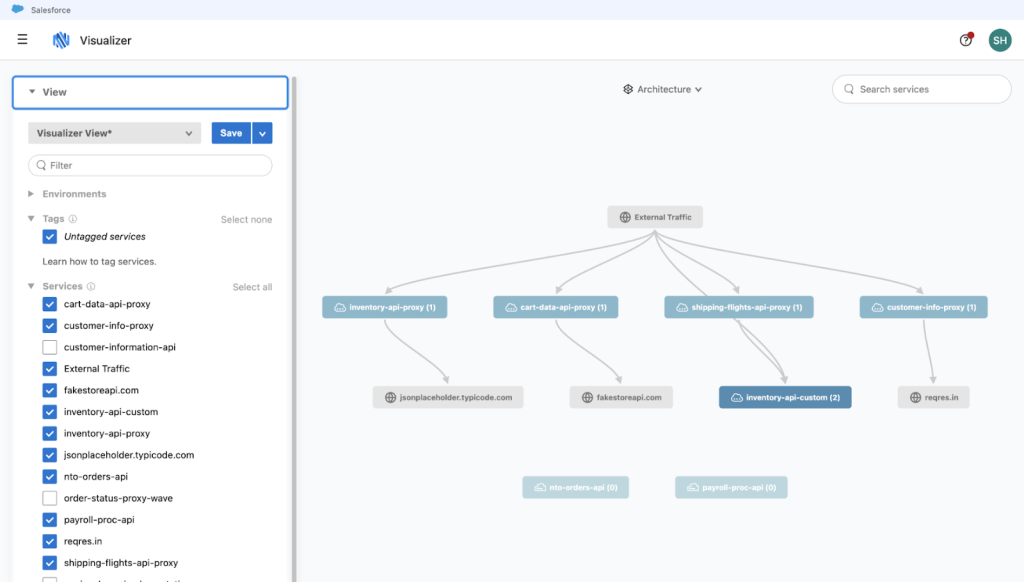
The benefits of being able to visualize your API structures in the context of their architecture, policy, and troubleshooting capability is twofold.
First, you can pinpoint performance issues through segmenting by app and system performance, and then map these dependencies automatically and troubleshoot any issues directly. Second – and this is an oft underrated benefit of visualizers in general – the schematic view can be easily consumed by business users, a useful quality when looking for strategic buy-in on your APIM strategy from the business side of the house.
Strategic monitoring: Anypoint Monitoring
The beating heart of MuleSoft’s monitoring offering will always be Anypoint Monitoring. It’s a tool that, through a variety of out-of-box and custom capabilities, provides a rich level of insight around every aspect of your application network performance, ranging from latency and response time, to log searching and proactive alerting. All to the end of drastically reducing service disruptions whilst simultaneously scaling more and more technologies.
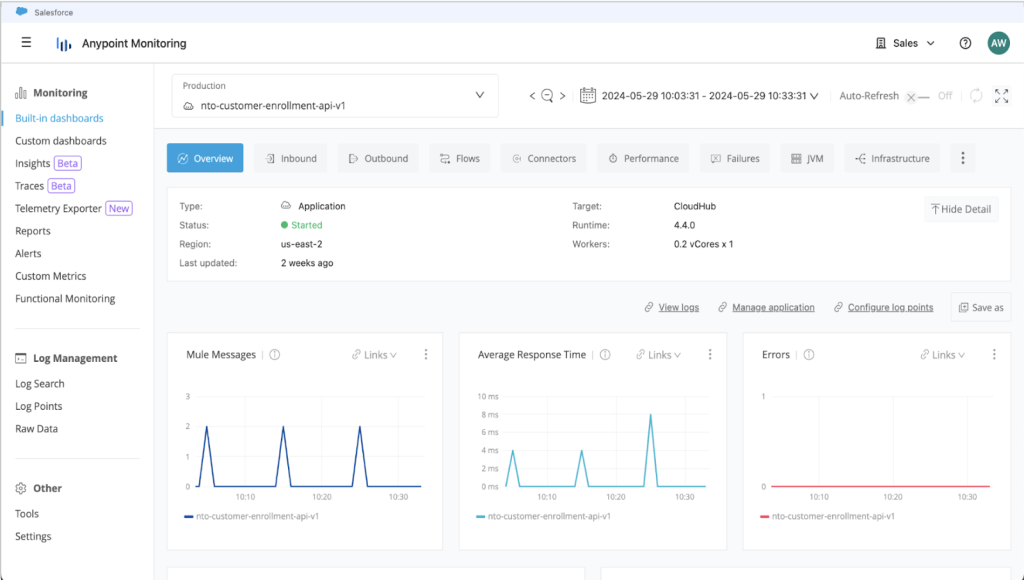
Anypoint Monitoring prevents operational issues from affecting your business critical integrations. When incidents do slip through the cracks, you can leverage the data garnered to inform strategic learning and build more robust application networks.
The value impact of monitoring tools is well documented. The median cost of outages for customers with full stack observability is 37% more than those without, and they also see a 2x annual ROI. With the advent and incorporation of so many new technologies like AI into application networks, monitoring and observability have never been more important.
Incident management: Tracing Experience (Beta)
As technology stacks become increasingly interconnected, it can be a challenge for IT teams to diagnose where cracks are forming in their integration pipelines.
Logging has been the traditional approach to solving issues; an application breaks, and you comb through the logs to decipher a fix.
But as your technology footprint begins to expand, logs themselves can create a bottleneck. They’re disjointed and have an application specific format; in order to get the full picture, you need to stitch them together and craft a solution.
This is easier said than done when you’re working with dozens or hundreds of applications.
Distributed tracing on the other hand, is focused around the requests being processed – not the disruption events being generated. They act as a header to each request that’s parsed from node to node. Think of it as injecting dye in a plumbing system to diagnose where you have leakage as opposed to looking for a geyser.
Operating in this way provides a holistic view of your technology stack and a more succinct understanding of the flow of data through it.
With the beta launch of Distributed Tracing in Anypoint Monitoring earlier this year, users can now visualize how their requests are being executed across the MuleSoft ecosystem and perform root cause analysis much faster with a global search of the application nodes that their trace passed through.
Traces are set to be the axis around which AI-driven observability is being built, and by automating the setup of your apps deployed on MuleSoft, a massive barrier to entry for getting started with the technology has been removed.
Observability ecosystem: Telemetry Explorer
One of the latest additions to Anypoint monitoring, Telemetry Exporter was designed to assist our customers and partners in integrating their preferred monitoring and observability providers with MuleSoft products and services.
Built on the Cloud Native Computing Foundations (CNCF) OpenTelemetry standard, our aim is to provide deeper insights into the execution of applications and APIs via tracing and allow developers to access monitoring and observability data from MuleSoft products and services via their third-party ecosystem.
When it comes to monitoring, we want you to have your cake and eat it too–that means fully-fledged, enterprise grade health monitoring & application network observability within MuleSoft, whilst also having one-and-done setup tools that let you stream telemetry data to the most popular third-party applications like Splunk, Dynatrace, etc.
Usage: Usage Dashboard (GA: Q4, 2025)
Earlier this year, MuleSoft shifted from our traditional licensing model to one driven by usage. To augment this new model, we want to provide our customers with a rich level of detail when it comes to how they use MuleSoft. It’s a win-win, as it becomes much easier to see the impact your Mule applications are having.
To this end, we’re happy to announce the upcoming release of a revamped usage dashboard in Q4 of 2025.
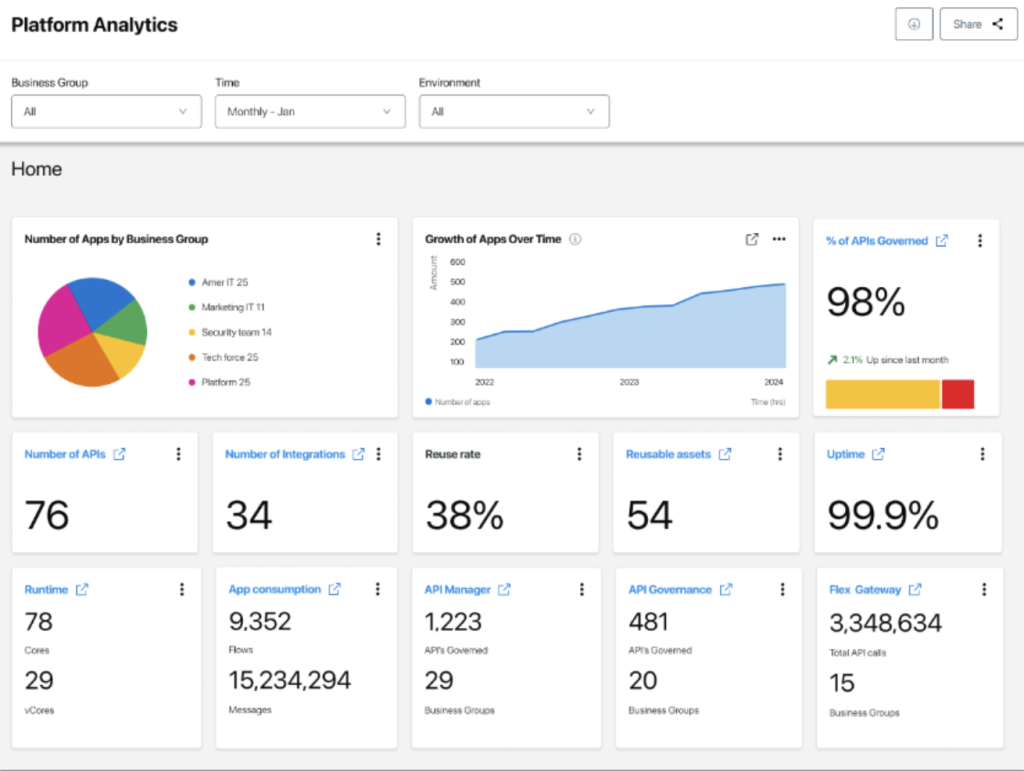
We believe providing our customers with a more granular understanding of their product consumption, will help IT orgs to illustrate their strategic value and gain a better understanding of how their technology ecosystem operates across their business.


