
Anypoint Platform vision and Summer 2016 updates
In our previous Runtime Manager blog, Production Lifecycle for IT operations, we covered the importance of a production lifecycle and effective monitoring and management strategies for IT Operators. This is to ensure that critical business operations are running at all time. In this blog, we will be going over how MuleSoft’s Anypoint Runtime Manager enables IT Operators to significantly reduce their MTTI (Mean time to identification) & MTTR (Mean time to resolution) with our summer release.
When you zoom into the day to day responsibilities of an IT Operator, they typically consist of deploying and monitoring the health and performance of their service implementations or mule integration application, and APIs, using lifecycle management on a cloud or on-prem production environment. MuleSoft’s Anypoint Runtime Manager (Version 1.5) enables IT Operators to deploy, monitor, and manage their assets in a production environment safely and effectively. The steps consist of securing and configuring the asset, monitoring it, troubleshooting to determine the root cause of a potential issue, and managing the API/Application within the runtime environment.
Stages of production lifecycle
- Secure & Configure: The production lifecycle being when the developers/QA team hands off a production-ready API/mule app to the IT Operator, to be deployed & managed in a production environment. IT Operators begin the process by configuring the asset with the appropriate system properties and authenticating it, so it runs in the production environment securely.
- Deploy: Once the API/mule app is signed and secured; it is ready to be deployed to a cloud or on-prem environment using the Anypoint Platform. The deployment is considered a success when “Started” status appears next to the asset.
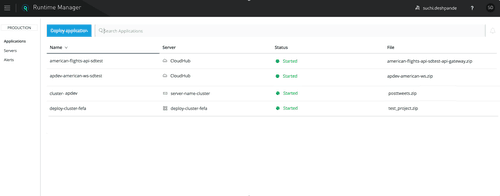
Description: Users can check the status of their deployments & systems, cloud & on-prem, on the Applications or Server sections in Runtime Manager. The single view enables IT Operators to monitor the status quickly and efficiently, instead of clicking through multiple views.
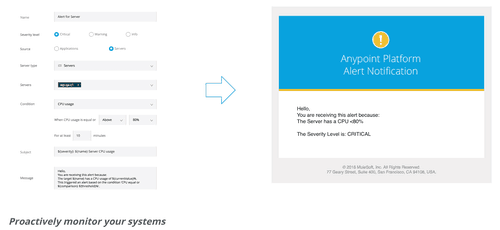
- Monitoring using Dashboards & Alerts: Once the API/mule app,& systems are running, users set up alerts & dashboards to monitor the health and performance over time. The monitor phase is typically broken up into two parts. The first part of phase consists of the user closely observing the asset using monitoring dashboards, until their performance, behavior, and effects on a production environment become predictable. Once they familiarize themselves and are comfortable with the effects of the deployments and systems they rely on the time & event based alerts and drill down into the dashboards only when they receive an alert. MuleSoft’s monitoring functionality enables users to be proactive, instead of reactive and enables them to detect & help prevent disasters before they occur.
Description: Users can monitor JVM metrics such as CPU & Memory usage and health and performance related metrics for their deployments. The peaks in the dashboards below clearly indicate that the server issue is being caused by errors in a specific application. In order to isolate the issue, they should proceed to the next step, troubleshooting.
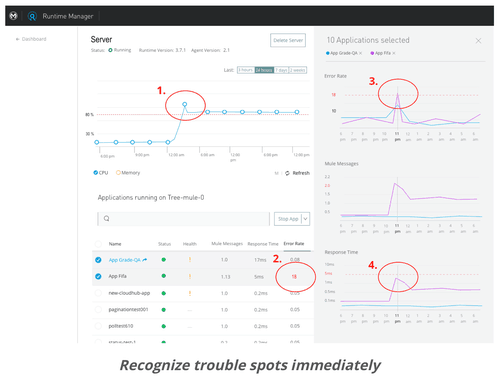
- Troubleshooting: In the event of an issue, or if the IT Operator wants to study the behavior of the application further, the user would be able to zoom in for granular visibility. It also helps identify the root cause of the issue within the application by providing event level information by checking for errors, activity level, and latency issues. Even though the IT Operator typically doesn’t fix/resolve the issue in runtime, it is critical for them to understand the root cause so they can take steps to prevent disasters from occurring.
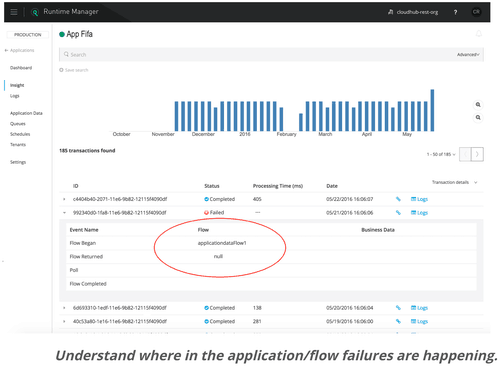
Description: The metrics above clearly show that the errors are occurring in one particular flow, within an application. From this, the IT Operator is quickly able to determine the cause of the issue, and it is attributed to a bug since he sees the same behavior from the API/mule app on other systems.
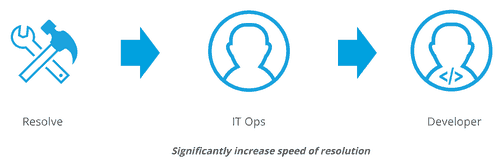
- Managing: Since the problematic flow is causing a ripple effect across the application and systems the IT Operators can take action in runtime, by managing the flow within runtime, instead of waiting for the developer to fix the bug and then re-deploy the API/mule app. This is a critical piece of functionality as it enables the IT Operators to keep business critical operations running even when an issue exists in the system.
- Resolving: While the IT Operator is managing the problematic flow in the application, he/she parallelly passes as much information as possible to the developer in a seamless manner. This is done by passing all the relevant mule events occurring before and after the error occurs. Since developers often do not have access to the production environment, it is critical for them to receive granular and isolated information specific to the issue so they can quickly debug, resolve, and re-build the app and trigger the lifecycle again. By passing isolated information, instead of terabytes of production logs, the time taken to resolve the issue is significantly reduced.
More info on Runtime Manager V1.5 release
As a product team, we are very excited to get closer to our vision with every release, Our key guiding principle, operation excellence through a single pane of glass, enables us to ensure that the functionality we implement is solving the right problems effectively for IT Operations in all organizations. Every release is built with the intent to:
- Reduce Mean Time to Identification (MTTI) & Mean Time to Resolution (MTTR)
- Increase speed to production
- Enhance visibility into our system
- Enable a unified and infrastructure agnostic platform
- Integrate easily and securely into third party ITSM tools of your choice
We are proud to announce our new upcoming Runtime Manager V1.5 release. It is capabilities enables IT Operators to keep business critical operations running smoothly. Mulesoft’s platform alerts, monitoring, and troubleshooting capabilities work in unison to detect and prevent disasters way before they occur, giving IT operators time to be proactive instead of reactive.In the event of a warning related to the health or performance of the system or the asset, the root cause is quickly surfaced and can be managed in runtime so that business critical operations can run uninterrupted.
Please check out the details on our upcoming release and contact your customer representative for more information.


