
Database schema migration is often an intimidating concept for many software engineers. In an ideal world, developers start with the perfect database schema that can scale to handle millions of requests to their service. But there can be times where you pick the wrong datastore or a data model that you need to change after your product is in the hands of customers.
Our engineering team at MuleSoft faced this challenge last year. One of the DynamoDB tables used by a critical service in production exceeded the allocated capacity, despite the usage being much lower than what was allocated. In the initial design of this table, we picked a schema that looked like this:
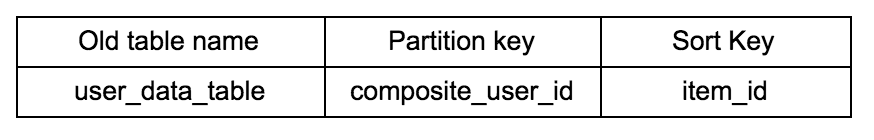
The partition key ‘composite_user_id’ was a composite key created from different fields, specific to a particular customer.
We started seeing throttling exceptions in our service and customers began reporting issues. Diving into the details, we discovered that the table had a hot partition.
To give more context on hot partitions, let’s talk a bit about the internals of this database. DynamoDB supports two kinds of primary keys — partition key (a composite key from partition key) and sort key. A partition key serves as the input to a hashing algorithm that determines which “partition” the record goes to, where partition refers to the physical storage node that is internal to DynamoDB. This hash-based partitioning mechanism exists to scale incrementally and split the data over the given set of nodes. Thus, all items with the same partition key are stored together, sorted by the sort key.
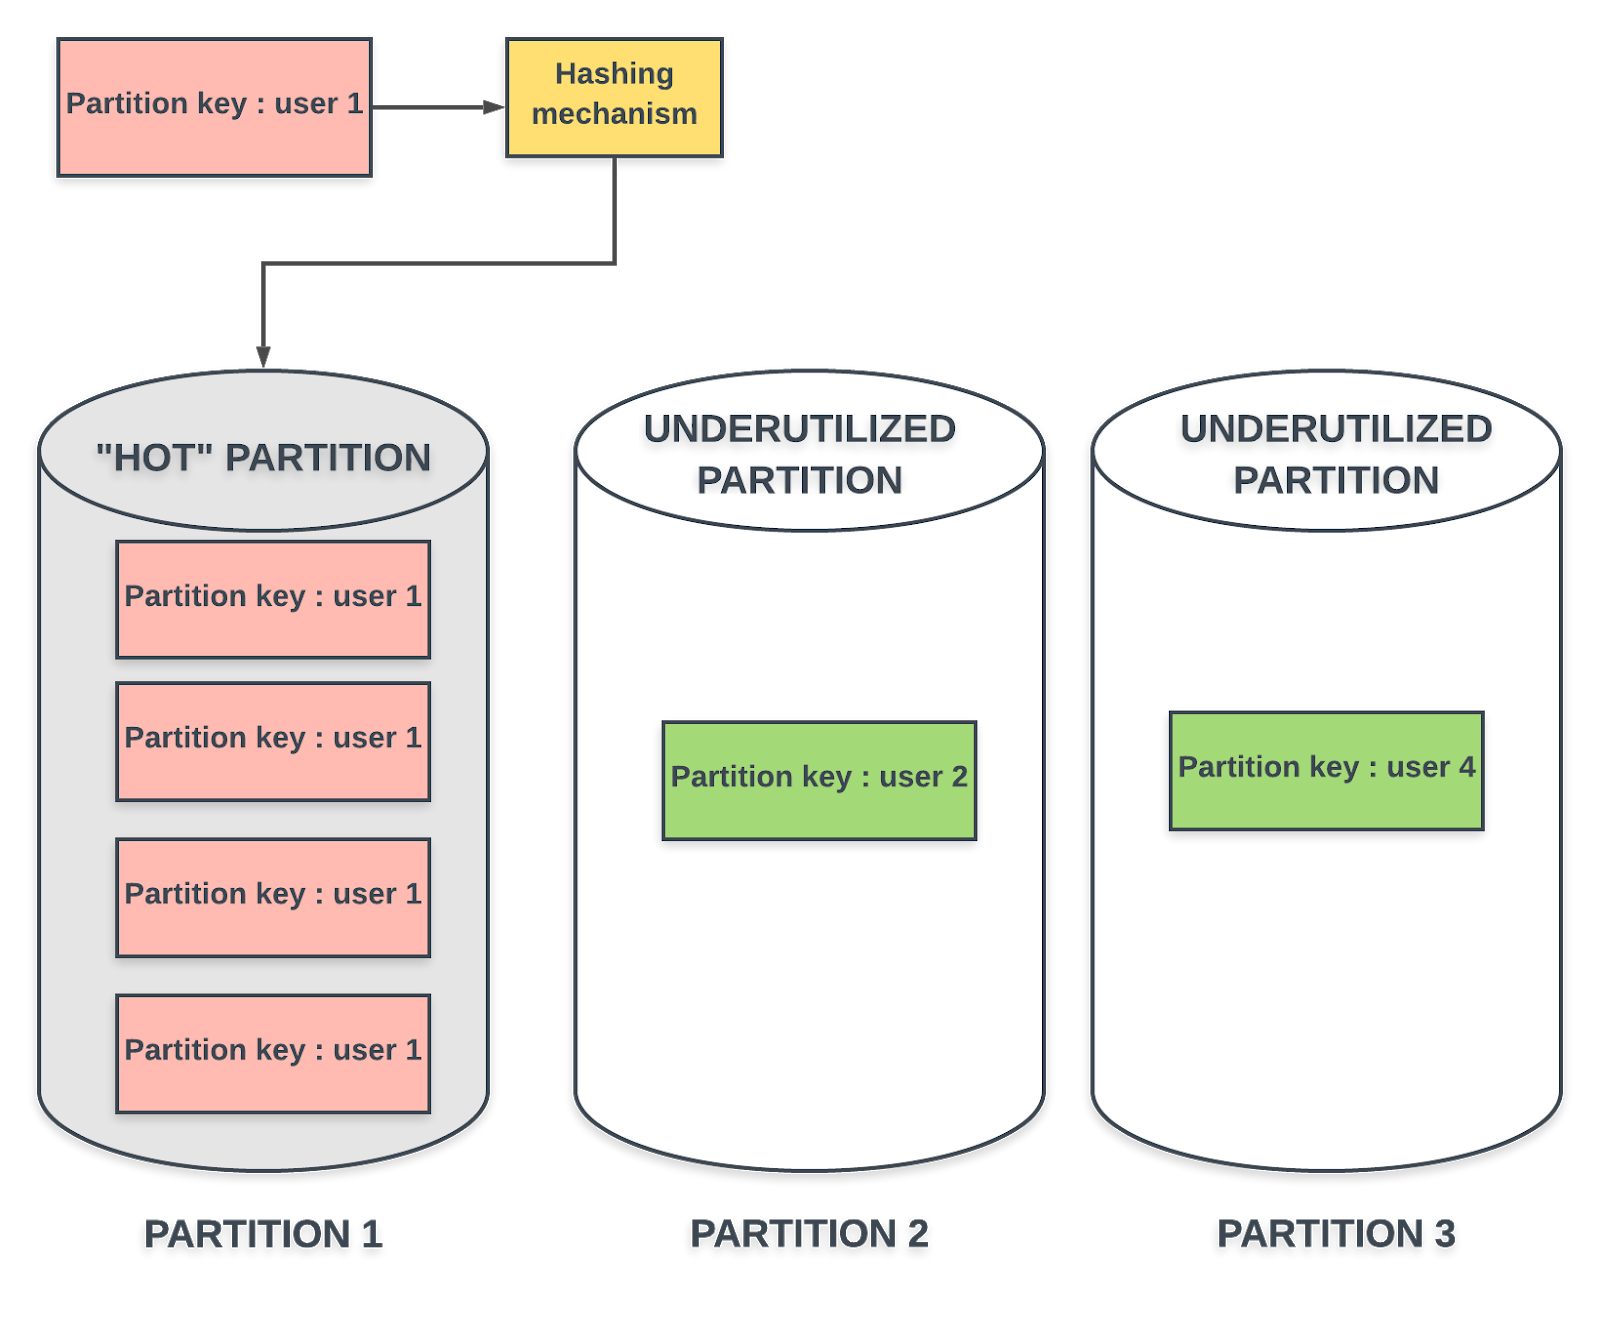
Imagine an application that uses DynamoDB to persist some type of user data. The partition key is a value that is unique to a user. To keep it simple, let’s say the user_id is selected as partition key and the hash of user_1’s partition key falls in the range of Partition 1 and that of user_2’s partition key is mapped to Partition 2. If the user_1 is a more active user than user_2, Partition 1 is more frequently accessed than Partition 2. For internals DynamoDB, the traffic against a particular partition key shouldn’t exceed 3,000 read capacity units and 1,000 write capacity units, regardless of the overall provisioned capacity on the table. Thus, with one active user and a badly designed schema for your table, you have a “hot partition” at hand, but DynamoDB is optimized for uniform distribution of items across partitions. This Amazon blog post is a much recommended read to understand the importance of selecting the right partition key and the problem of hot keys.
We expected our service to scale linearly with the provisioned capacity on DynamoDB. But hotkeys in one of the partitions of the tables hindered our vision to scale our service to meet higher customer demand. To solve for hot keys, we needed to change the composition of the primary key of this table. This gave us the task of creating a new table with a unique primary key and migrating all records to this new table.
Solution
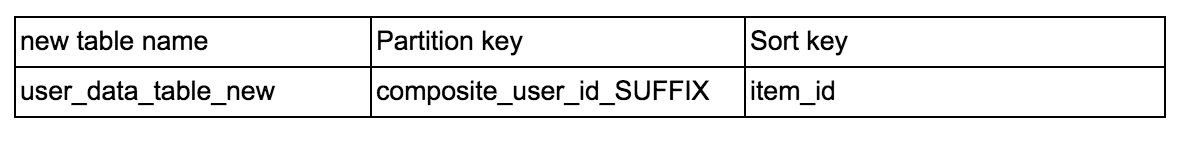
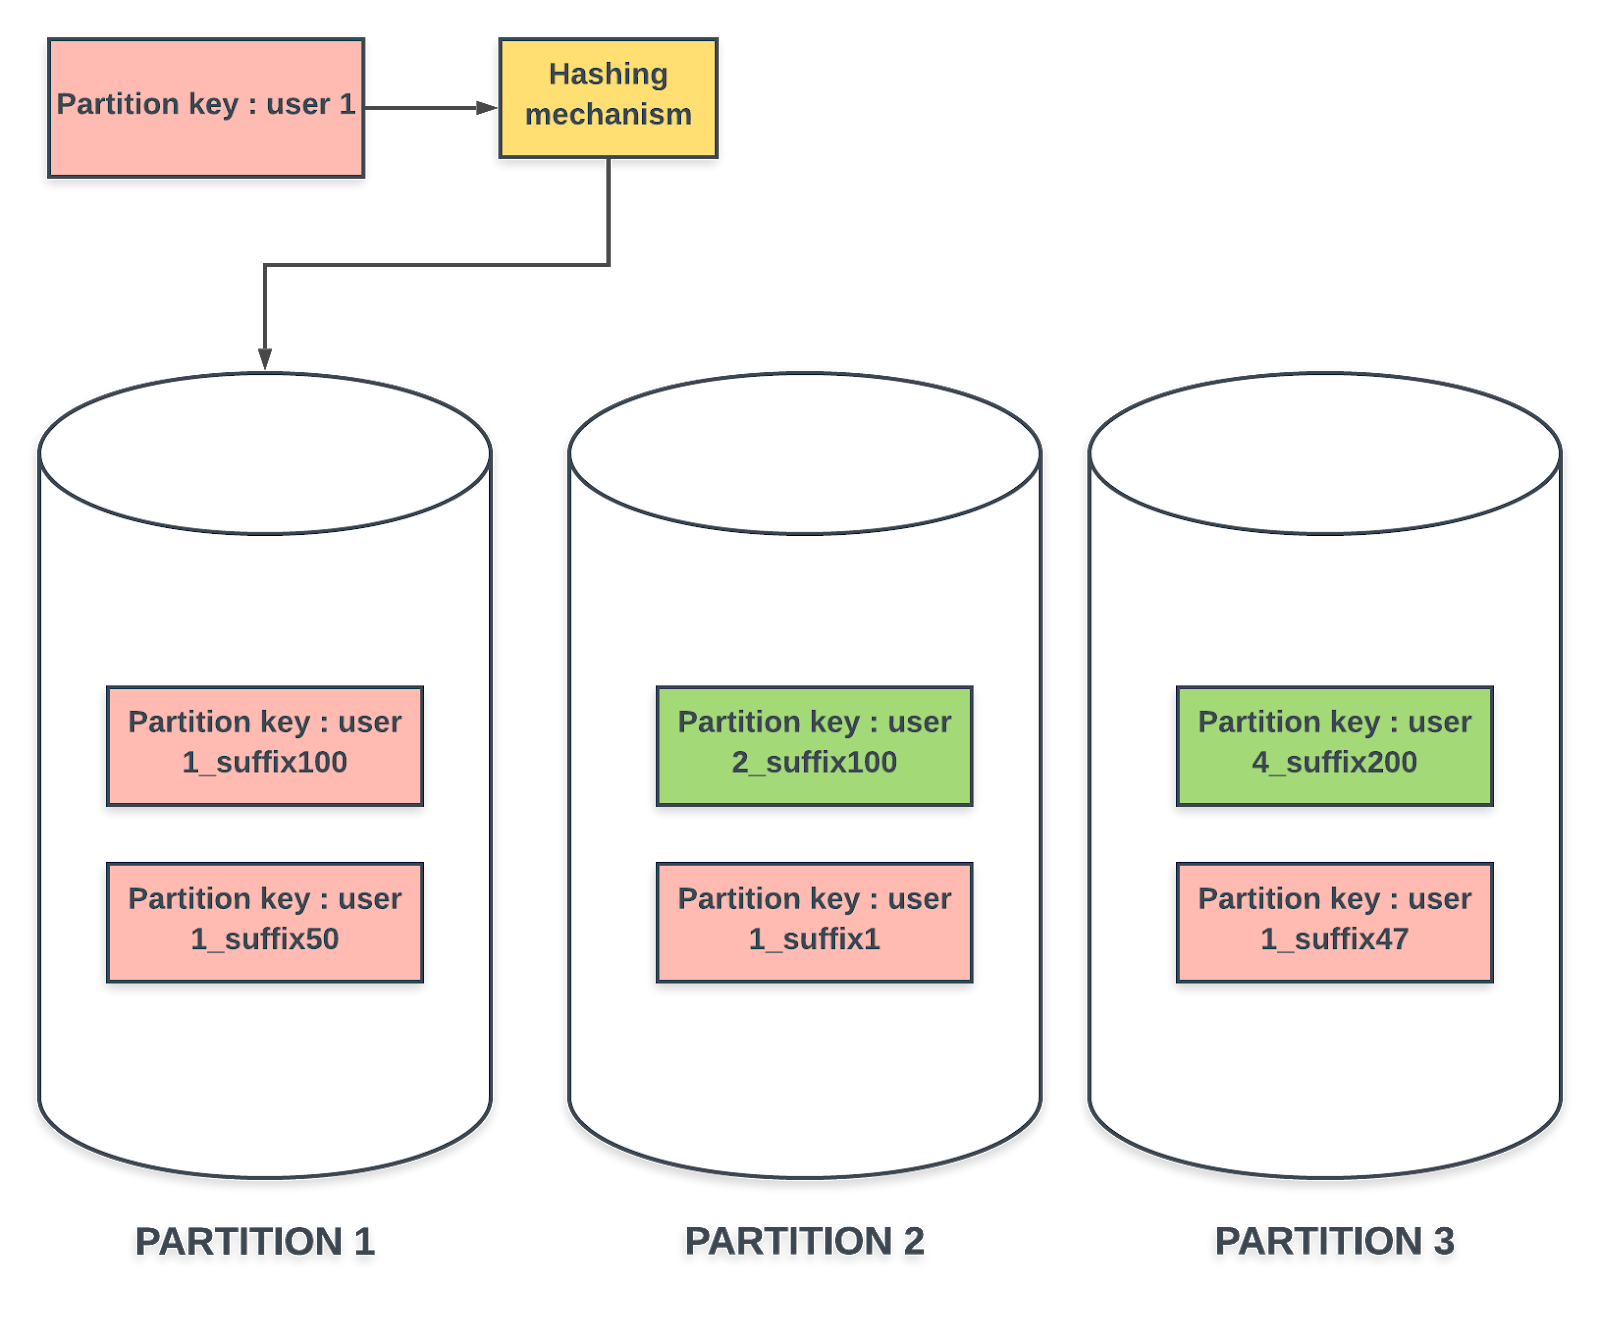
A simple way to solve this problem would be to limit API calls but to keep our service truly scalable, we decided to use write sharding. We needed a randomizing strategy for the partition keys, to get a more uniform distribution of items across DynamoDB partitions. We added a suffix to the partition key, which was a randomly generated number from a predetermined range. This ensured that items from the same user were uniformly sharded across the given internal nodes in DynamoDB. This is the new schema that we wanted for the table:
One challenge of this solution was that it required significant application level changes. Also, the range of suffixes might affect the performance of queries if it required scanning the whole table. There are two criteria that influenced our decision on the range for suffix — the scalability target we had on our backend which affected the number of Dynamodb partitions, and the query performance that was affected by the range of suffix. After a few tests, we settled on a range of suffix that gave us a good tradeoff between scan efficiency and uniform sharding.
The MuleSoft platform supports billions of API requests on a daily basis and we wanted to make sure that this database-level fix wouldn’t affect our service SLAs. One of the requirements for this process was that the service would not have any downtime. To maintain high availability and consistency of our service, we decided to do an online migration — so the migration was performed while traffic still existed to the application.
Steps in migration
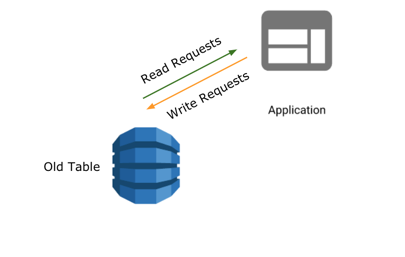
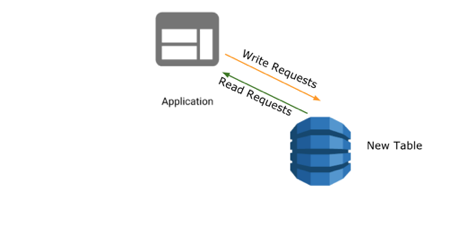
Before the migration started, the application directed all reads and writes to the old table.
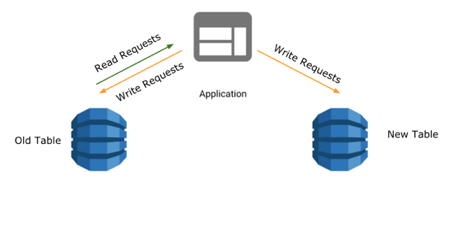
The first step in migration was to fork writes to the new table. Records remained the same except for the partition key in new table that was attached to a random suffix. All new writes were non-blocking and did not affect the existing availability and throughput of the service.
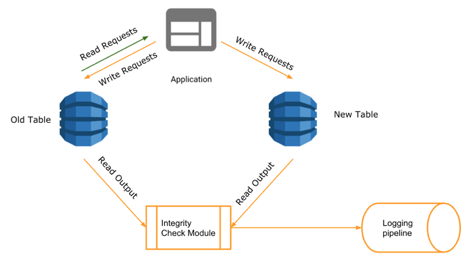
Once the writes were forked, we had to make sure that the integrity of data was preserved when it was forked to the new table. For this, we used the read requests to the application to perform a validation of data integrity. An integrity check module was embedded on the application layer, which compared the items read from old and new tables and logged any discrepancies. This phase of migration was critical as we could make multiple iterations to prevent any malformed data with the combination of forked writes and integrity checks.
Failed requests to new table and integrity check failures were closely monitored and fixed during this step of migration. This mode was enabled for 30 days because the data in the table that we wanted to migrate had a TTL of 30 days. This significantly simplified our problem statement. Often online migration has to be backed by an offline migration, when there are records to be migrated that aren’t frequently accessed. The engineering team at Tinder describes such an initiative they did here at AWS Reinvent.
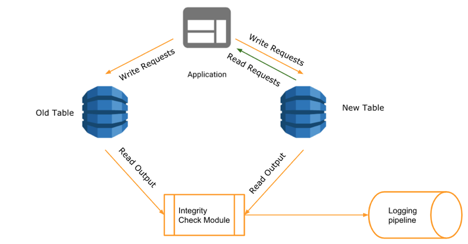
Keeping the write forks and online validation in place, we switched the read paths to the new table. Once we were confident of the new data paths and no regressions were reported, we got rid of old tables and integrity check layer.
Observability
Observability is the different ways to monitor your system. Our services were already monitored at both the machine level and the application level. Machine-level observability included monitoring system metrics like CPU usage, network metrics, and storage utilization. At the application level, we monitored error rate, available threads in the thread pool, heap memory usage, and so on.
More granular observability measures were required during the migration phase. We enabled transaction traces at database level to monitor how the data paths to new tables were performing. It was also important that we were able to see how the integrity checks were progressing over time, how many DynamoDB transactions failed, how many read/write requests went to the new table, etc. Because we couldn’t directly use DynamoDB or AWS tooling to see how well our migration was progressing, we relied heavily on the Custom instrumentation feature in New Relic. We leveraged New Relic Insights dashboards to provide visualization of how the migration was progressing over time.
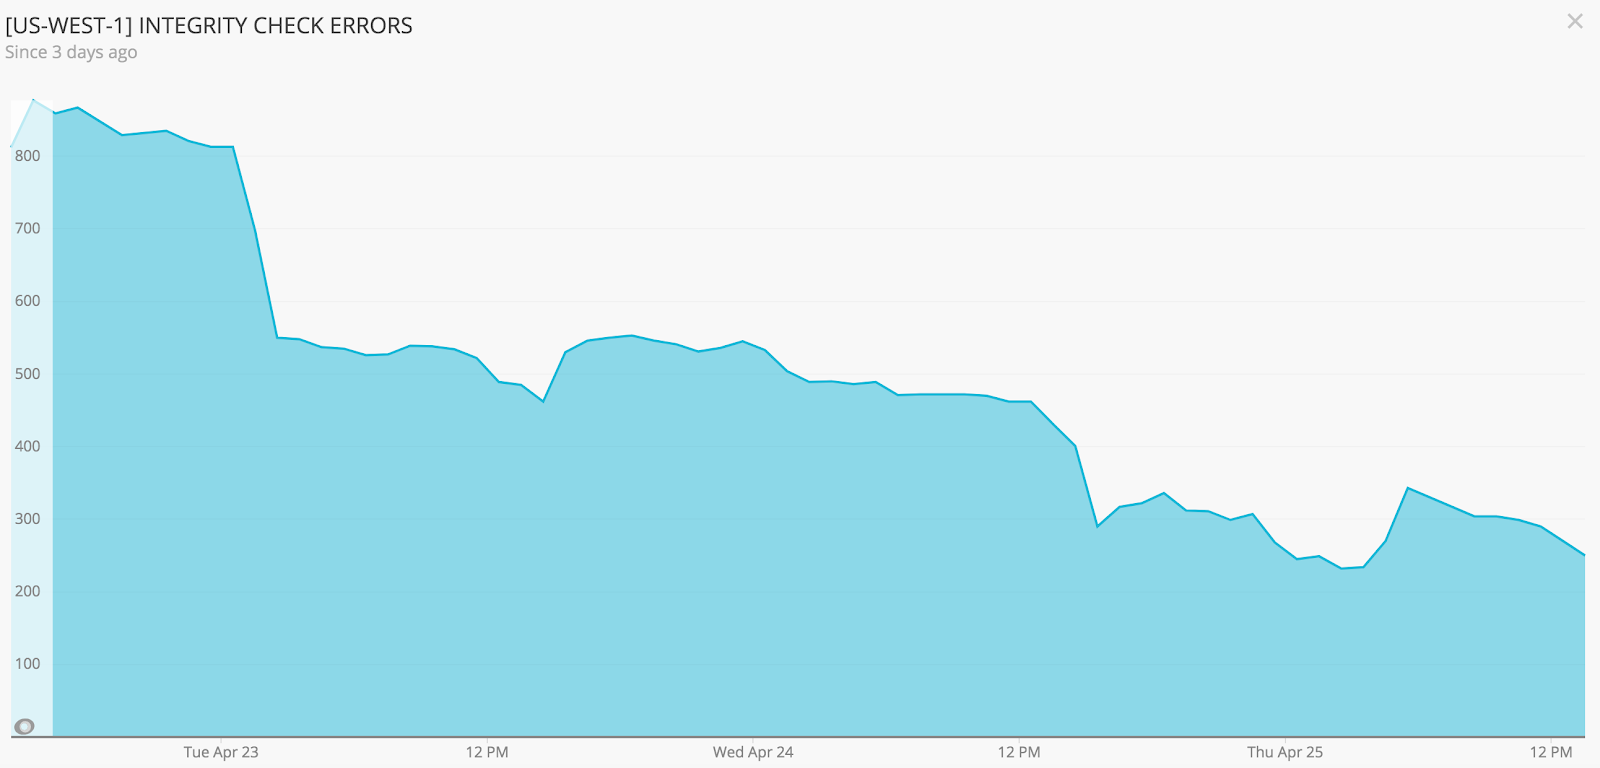
The above graph from New Relic Insights shows how the number of errors, which is the number of differences between old and new tables, went down to zero over time. At the beginning of migration, fewer keys existed in the new table, which resulted in many integrity-check failures. As more write requests came to the tables, the data in the new table became more similar to the old table, thus reducing integrity check errors.
Conclusion
With a multi-stage process that spanned over a four to five month period, the project was successfully wrapped up — we changed the schema in a table, made the service more scalable, caused zero customer issues during the process! HUGE SUCCESS!!
A couple of takeaways from this project:
- DynamoDB access pattern should decide your design pattern. Finding the right composite partition key plays a major role in how your service can scale. Modifying an existing schema will be a costly operation.
- Observability is a savior. Investing time on a couple of useful dashboards and alerts removes a lot of repeated, manual validations off your shoulders.
- Tooling is an important design consideration when you pick your datastore. Operations like renaming a table or changing the schema are not as straightforward in DynamoDB as it is in relational databases.
For more MuleSoft engineering content, see the “Engineering” section of our blog.


