
Jose Ramón Huerga is an experienced MuleSoft Architect at Everis. He is a multi-MuleSoft Certified Developer and Architect who frequently speaks at MuleSoft Meetups in Madrid. Jose Ramón shares his findings after completing a Mule Runtime 4.3 performance test.
The new Mule runtime 4.3 introduced several changes in thread pool management — which may be leaving developers to wonder how it affects performance. This article describes the performance of an API that uses HTTP requests and DataWeave.
MuleSoft introduced Mule 4.3 runtime which includes several changes in the way it handles threads. In the new threading model, the CPU_LIGHT, CPU_INTENSIVE, and IO thread pools are combined into a single thread pool: the UBER pool. Additionally, the proactor design pattern is used, so the different operations of a Mule flow are classified in categories and executed with threads of IO, CPU_LIGHT, or CPU_INTENSIVE depending on the task. Some thread switches are omitted — for example, if a CPU_INTENSIVE is followed by a CPU_LIGHT operation, that task will remain in the CPU_INTENSIVE thread.
During one of my projects, I wanted to check the API performance that uses a combination of different types of operations (HTTP requests, Dataweave transformations, etc.). I was curious if Dataweave operations add significant overhead in the CPU, or how many requests per second can handle a small worker running in just 500 MB.
Creating an API to expose four endpoints
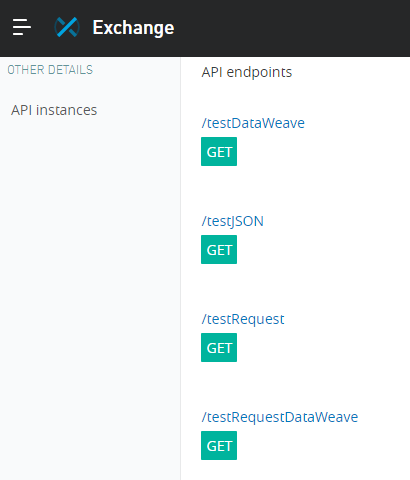
To test that, I created a simple API that exposes these four endpoints:
- TestJSON: This endpoint returns a simple JSON object with five or six attributes.
- TestDataWeave: This endpoint transforms that JSON object using math, date, and substring operations.
- TestRequest: This endpoint invokes TestJSON using an HTTP request connector.
- TestRequestDataWeave: This endpoint invokes TestJSON using an HTTP request and modifies the output using the previous DataWeave Transformation.
I published the API definition to Exchange:
Creating a Mule project to implement logic
Once the API was published, I created a Mule project with Anypoint Studio implementing the logic, using these four flows:
- TestJSON:
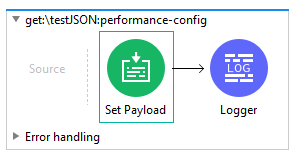
The payload is set using this code:
output application/json
---
{
  "text1": "Text in uppercase and lowercase",
  "text2": "Red Blue Green",
  "date": "2020-10-06T00:00:00.000Z",
  "number1": 13,
  "number2": 7
}
- TestDataWeave:
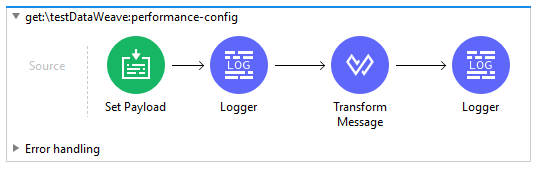
The Transform message contains this code:
%dw 2.0
import * from dw::core::Strings
output application/json
---
{
date: now(),
text1: upper(payload.text1),
text2: substringAfterLast(payload.text2,"Blue "),
number1: payload.number1,
number2: payload.number2,
sum: payload.number1+payload.number2
}
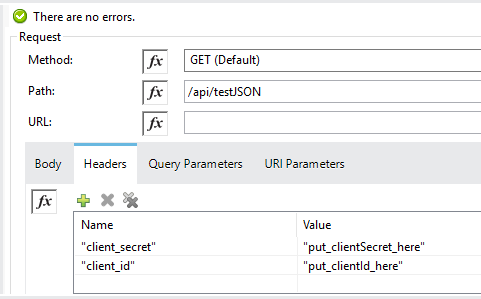
- TestRequest:

The Request just invokes the testJSON endpoint:
- TestRequestDataWeave:
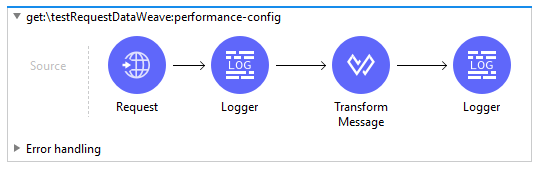
This flow first invokes the TestJSON endpoint and transforms the output using the DataWeave code shown before.
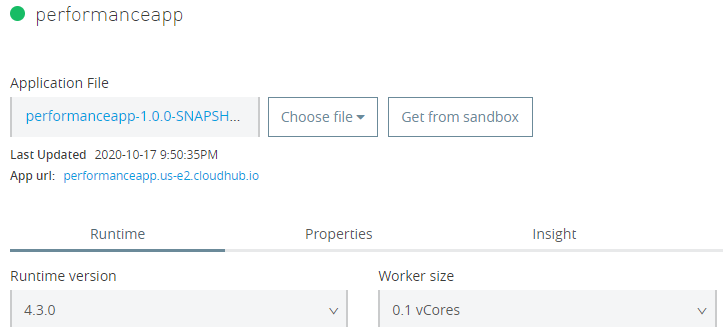
Deploying to CloudHub
Once the API was developed, I deployed it in CloudHub in a 0.1 vCore worker:
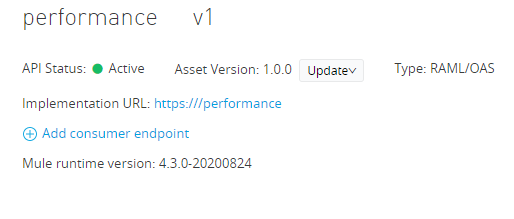
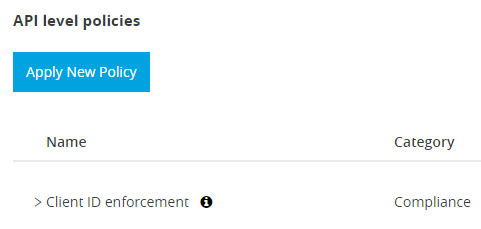
As I wanted to simulate a realistic scenario, I created an API instance protected with client_credentials:
Performing stress tests using JMeter
To stress the API, I created a JMeter load test that invokes the four endpoints:
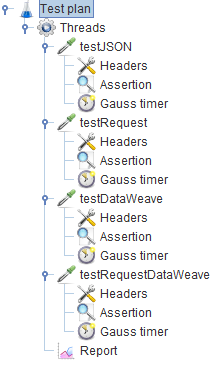
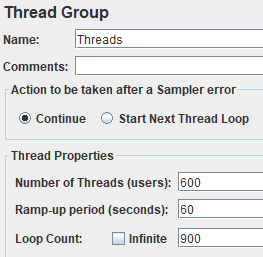
The JMeter script uses between 300 and 600 threads, with a ramp-up of 60 seconds:
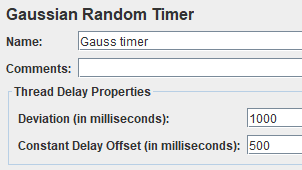
A Gaussian random timer is used between requests, with a constant delay of 0.5 seconds and a deviation of one second:
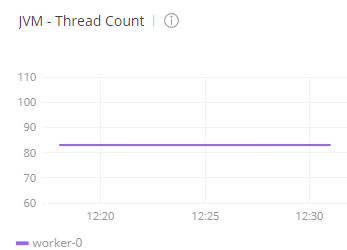
Before the test, I checked the status of the worker in CloudHub with Anypoint Monitoring. I found the CPU was below one percent and the number of threads of the worker was 83:
Testing with 300 threads in JMeter
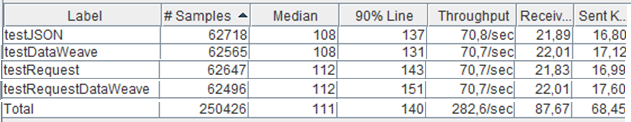
First, I tested the API using 300 threads in JMeter. The median of the TestJSON is around 108 milliseconds (this time includes the execution of the API and the download of the information to my laptop). The DataWeave operation is not adding significant overhead. The TestRequest and TestRequestDataWeave adds four milliseconds. Overall the scenario got a throughput of 280 requests per second. You can see all of my results in the table below:
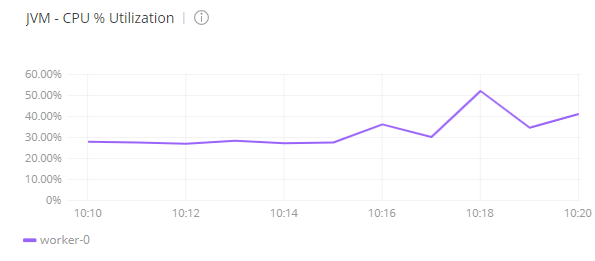
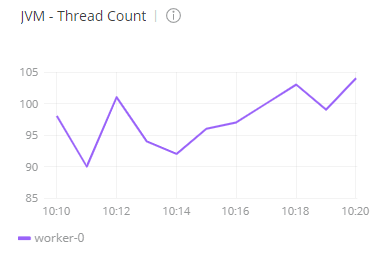
When checking Anypoint Monitoring, it shows that during the test, the CPU of the worker was between 30% and 40%. The number of threads of the worker was between 95 and 105:
Testing with 600 threads in JMeter
I repeated the test doubling the load. I used 600 threads in JMeter, however, the response times are similar, around 110 and 116 milliseconds. Overall the scenario got a throughput of 543 requests per second, almost the double of the previous scenario, which is the expected result, as I used exactly the double of threads in JMeter. See results below:
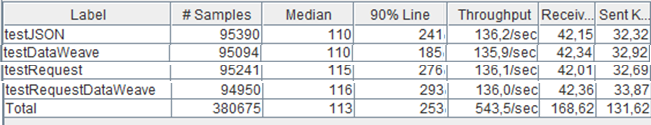
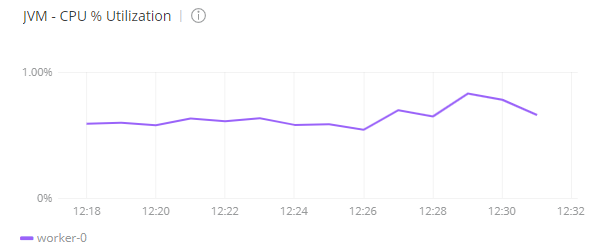
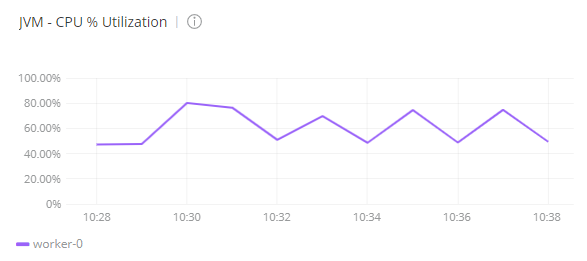
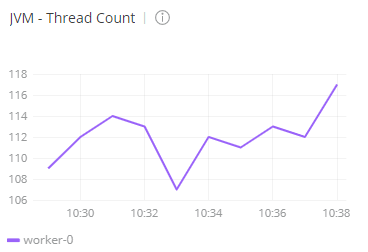
For this test, Anypoint Monitoring shows that the CPU usage was between 50% and 70%. The number of threads of the mule worker was between 110 and 120.
Takeaways from my performance testing
The conclusions of the tests are:
- The performance of Mule 4.3 and ability to withstand stress tests outperformed my expectations. It can handle more than 500 API calls per second in a small worker of 500 MB, and the CPU is still below 80%.
- The overhead of DataWeave is not excessive. Although the API has used operations such as now(), upper(), substringAfterLast(), the response time was not affected.
- The invocation of other APIs using HTTP Request is very fast, as it only adds five milliseconds to the response time. Keep in mind that Client ID enforcement policies are executed in every request of the API, but they are not adding significant overhead.
- The number of threads of the worker was able to scale from the initial set of 83 threads to 118, which is an increase of 35 threads.
If you want to repeat my test, you can download the API, the mule project, and the JMeter script in my GitHub repository.
Note that these testing results are specific to my environment, and cannot be guaranteed nor are representative of every possible environment due to the hundreds of variables at play.
If you are interested in learning more about Mule 4 performance, check out MuleSoft’s official performance benchmarking report.


