This blog post is the third in the new Mule agent blog post series.
You can access the first two blogs here:
In this post, I’m going to talk about some of the common use cases we envisioned for the agent as we were developing it.
The vision we had when building the agent was that it would be the primary interface to access the Mule runtime. It facilitates platform agility (it can release faster than the Mule runtime) without compromising backward compatibility (it will maintain proper API versioning).
The ability to interface with the Mule runtime via APIs as a very powerful capability. Through clearly defined, documented, secure APIs, users who leverage the agent can tie in cleanly to their existing SDLC (software development lifecycle) processes involving Mule. For example: Mule application deployment and runtime operational visibility.
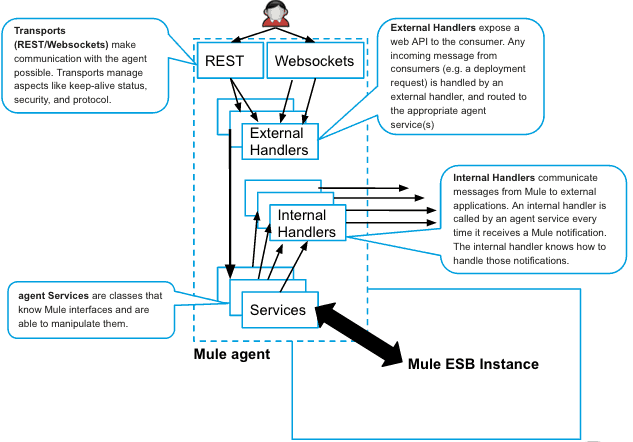
Before we talk about the possible use cases for the agent, it is important to understand the agent’s architecture, which you can read about in our documentation. To supplement the information in our docs, I’ve also created a diagram (see below) describing the different components of the agent.
In the diagram, the new Mule agent sits inside the Mule instance and interfaces with the Mule ESB (or API gateway) instance at runtime.
Each of the components described in the diagram above are extensible; users can create new components by implementing agent interfaces. The components are also dynamically configurable; many component attributes can be dynamically turned on/off or modified at runtime.
Here are some of the common use cases we see for the new agent:
Publishing Mule metrics to existing monitoring systems
The new agent can be configured to publish Mule metrics directly to other systems. This is done with a combination of an appropriate agent service that collects information from Mule (e.g. the JMX service that collects JMX information from Mule), and an appropriate agent internal handler (aka publisher) to push metrics to other systems. We’ve actually written and open sourced several internal handlers. At the time of this blog post’s writing, we currently have the following publishers open sourced and available for download:
- Cloudwatch
- Graphite
- Nagios
- Zabbix
Note that at this time MuleSoft does not officially support these publishers. We can only help if there are problems with the agent APIs, not with the publisher code.
If you don’t see your monitoring system listed above, don’t worry. The steps for creating your own publisher are listed in the documentation. We also encourage users to actively contribute new publishers to the mule-agent-modules Github repository.
Currently, the metrics available for publishing are those exposed by the JMX service. That said, users of the new agent can also build their own services that collect other metrics from Mule. In the future, the agent engineering team may also look into building other services that collect different sets of metrics.
Deploying Mule applications automatically via APIs
The new agent provides a mechanism to deploy a Mule application via a REST or Websockets API. For a quick demo on how to deploy via REST, watch this short video I created. Using Websockets is a bit more complex to build a client for, but Websockets is a full duplex communication channel, which means that as an application is being deployed, clients can get real-time feedback about the application’s deployment state.
The ability to automate Mule application deployment is a feature targeted to operations teams. Currently, the only way to deploy a Mule application with an API is to leverage the Mule Enterprise Management Console (aka MMC) APIs, but that requires standing up a separate app server for MMC. Otherwise, deployment has to be done by SSHing into the box where Mule is running, copying the Mule application into the /apps folder, and waiting until the Mule application anchor file appears. This process is more tedious and error prone. The Mule agent now allows you to deploy a Mule app directly with an API called directly against the Mule instance.
Tracking detailed events in Mule applications
Many of our customers have asked about detailed event tracking to inspect the state and contents of a Mule message as it goes through a flow. Customers want that data to be accessible directly from the Mule instance outside Mule Enterprise Management. With the new Mule agent, this is now possible. You can read all about how to do it here. Basically, users can configure various debugging levels to specify the level of granularity for capturing event information from Mule applications. Information captured can then be used as input for other operations applications or processes in the enterprise, thus increasing runtime visibility for Mule applications.
Furthermore, users can create and customize different publisher buffering strategies for controlling the flow of event tracking information from the agent into third party systems. Proper configuration of a buffering strategy allows for handling unexpected events like network or system outages. Read more about configuring publisher buffering strategies here.


