
Demir Akarsu is a Software Engineering Specialist at BP who helped BP adopt and continue to successfully manage Runtime Fabric. He is a MuleSoft Certified Developer and recently shared BP’s Runtime Fabric story at the Developer Meetup during the EMEA Summit-Germany.
This blog will deep-dive into BP’s adoption and management of Runtime Fabric in a mature hybrid deployment environment. I will be discussing how to remove the ambiguity between the deployment offerings and provide ideas on how to improve customer experiences and enable your Center for Enablement (C4E) teams at your own organizations. A quick disclaimer for the remainder of the blog, the data you see in the images below is dummy data and does not represent actual data at BP.
Why we chose Runtime Fabric
When an organization first adopts MuleSoft, it often adopts CloudHub as the default deployment platform, which is exactly what BP did. However, this platform sometimes doesn’t cover enough use cases for our customers because CloudHub primarily routes and handles external traffic only. This doesn’t mean you can’t route to internal systems, it is just more difficult. Additionally, the ecosystem is fully managed by MuleSoft. As our platform matured, and we wanted to expand the use cases we support for our customers looking to use MuleSoft, we sought on-premises options. On-prem has its own drawbacks as it is internal only, it’s managed by another internal team, and uses a different control plane to Anypoint Platform. Thus, there is a steeper learning curve for new MuleSoft developers. Overall, these options weren’t efficient enough and had limited flexibility. So, we started looking for a solution that removed the complexity and allowed the C4E team to govern and manage the platform.
That’s when we found Runtime Fabric and realized it offered a solution to address these complexities. If you are unfamiliar with Runtime Fabric, it is a containerized service that automates the deployment and orchestration of Mule applications and API gateways. Runtime Fabric runs in custom-managed infrastructure such as AWS or Azure. At BP, we use Azure. In Runtime Fabric, it is quite similar to CloudHub where it leverages a majority of Anypoint Platform’s features including the control plane.
There are some shared responsibilities and ownership between MuleSoft and the customer. For example, MuleSoft is responsible for the product itself and all delivered components such as the Runtime Fabric appliance, agents, Runtime engine, and other dependencies for Mule applications. The customer is responsible for the provisioning, configuring, and managing the infrastructure required for Runtime Fabric including VM resources, operating systems, load balancing, and kernel patching.
Enhancing our Runtime Fabric experience using CI/CD pipelines
Let’s now dive into how we enhanced BP’s Runtime Fabric experience using CI/CD pipeline integration. Below is the Mule ops pipeline that BP uses. Within BP, our Mule applications can be deployed to different platforms via CloudHub or our on-prem platform.
As I mentioned, our on-prem platform is fully managed by another team, so we built a deploy and release one click pipeline to support deployment to CloudHub and our Azure Runtime Fabric. This removes the ambiguity between the two platforms and dependencies on the other team. The pipelines are intended for the projects to deploy to both CloudHub and Runtime Fabric by separating out our build and deploy phases. One of the added benefits for our customers is that this uses a unified deployment model meaning everything goes through this pipeline regardless of the platform it’s deploying into. As you can see in the image below, we do cover a rather large feature set.
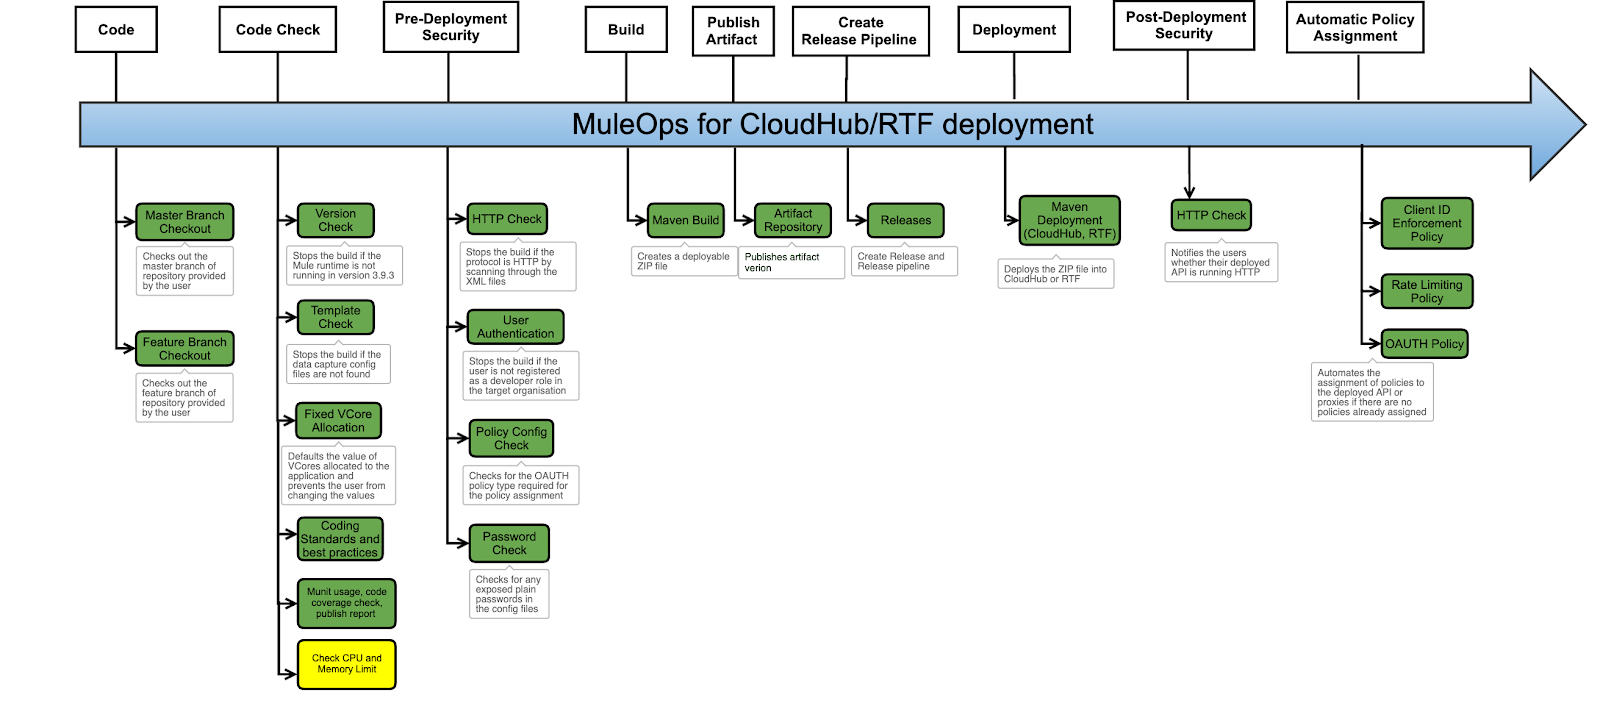
The image represents our build pipeline. One feature set that may stand out to you (highlighted in yellow) is CPU and memory limit check for Runtime Fabric. Governing resources on Runtime Fabric is not as straightforward as CloudHub. In order to avoid overconsumption and allocation, we’ve removed all manual deployment to our platform. Thus, everything has to go through this Mule ops pipeline with a default use of 0.1 V cores and 500 megabytes of memory. If anything extra is required, it goes through engagement with the C4E team. We have other means of governing and looking into those resources.
Release pipeline: Four development stages
We also have a release pipeline consisting of standard four stages representing development, testing, staging environments, all the way through production instances on the platform. Deployment to the development instance is done automatically through this release pipeline and users are then authenticated in that pipeline to make sure they have the required profile to deploy. This includes ensuring they are part of the business group so we don’t have an overabundance of users deploying whatever they want or consuming resources. To provide flexibility to the project teams, deployment to the test instances are triggered by the project teams themselves. The latest version is then deployed to the development instance and it’s by default picked up by the pipeline for deployment to subsequent tests and production instances.
After the successful testing of applications, deployment to production is triggered manually by a project team. We mandate teams’ projects use ServiceNow so they have a valid change in place to proceed with their deployment. The pipeline validates the ServiceNow change request number that’s provided by the user to ensure the validity of the ticket and ensure approval status is within the time window requested. To summarize, pipelines can be built as complex as this, but also remove the minor differences between different deployment targets. On our Runtime Fabric, we have multiple clusters for several different use cases and developers may not know when they’re reusing these pipelines that there is any infrastructure difference whatsoever between the deployment options.
My advice is to treat all of your automations and pipelines in this manner to remove ambiguity. At BP, by following this mindset, we now have tools open to our developers to allow them to use CloudHub or Runtime Fabric by just changing a single variable. For example, we’ve created proxy automation pipelines. This lets developers skip the development phase of the project lifestyle and onboard with a proxy customized to their use case. It will be deployed on Runtime Fabric or CloudHub, depending on what they choose, and they’ll take care of all of that automation targets as well as publishing all of the assets such as to Exchange, API Manager, runtime itself, etc. Thus, our Mule ops pipeline creates these assets and greatly reduces developer time overhead.
Managing Runtime Fabric with monitoring and alerting tools
Building the Mule ops pipeline for BP is only one small part of the ways we manage our Runtime Fabric implementation — monitoring and alerting tools are also important. During our journey at BP, we were early adopters of Runtime Fabric and therefore some of the monitoring and alerting features that are currently available weren’t accessible to us originally. So, as time progressed, we rolled out our own monitoring and alerting features. For BP, this has allowed us to have a 360-view of our API landscape. There are a wide variety of tools to use, but we use the Grafana Dashboards which is an out-of-the-box feature of Runtime Fabric. We built the experience required to allow access to this platform for real-time application monitoring fairly seamlessly. However, we do have logs coming from a variety of platforms.
This causes issues as we have to manage varying restrictions, Linux coding, and determine access levels internally and externally. This can be quite difficult to learn and familiarize yourself with especially if you are a developer deploying to two or more of our platforms. You don’t want to have to go to each platform and work through the containerization to get the logs. Thus, we decided our logs would be in one location. To do so, we built custom Log4j appenders to log forward into Splunk. We’ve enabled this using HTTP event collectors. Now, as part of our onboarding process, there is another application we use on Salesforce that project teams would go into and enter information about their APIs and licenses required — such as what type of API it is and a bit about the use cases, etc. Once that gets approved, we provision Git Repos with template starter kit Mule Apps that come out-of-the-box with log forwarding and various other setups which take care of the integration into the Mule ops pipeline for deployment and production. The reason for doing so was Anypoint Monitoring was not yet available and we wanted to make sure we had accurate monitoring.
Additionally, we use an API layered approach that we’ve published process APIs and encapsulate data from all of our platforms to allow project teams to visualize KPIs that might be desirable to consumers or project leads, not necessarily the developers themselves. We provide an experience API as our out-of-the-box offering to have this visualization already in place with custom dashboards that project teams are free to use, but the main goal of this was we built process APIs that can be reused to visualize or even alert in other sources such as the power of business intelligence (BI). You can store your data in data lakes that we now have reusability available. Some of the data we have built APIs to pull the data for us include: API resource quota, response times, top consumers and endpoints, and API health.
Alerting dashboard
We’ve also done some work on our own out-of the-box offerings for alerting based on all of our different platforms. In Runtime Fabric, there are server alerts that go to mailboxes and our Slack channels using SMTP protocols to alert users of applications whether they’re high consumption or low consumption based on certain thresholds of CPU and Memory or restarts or peaks. We do this by triggering alerts from data that we send to Splunk and use Runtime Fabric cluster alerting.
Moving forward, with the C4E teams themselves, there’s a lot of other ways to drive efficiency, especially if you have smaller teams. The question is, how can your C4E teams reduce the manual overhaul and drive efficiency? For those who maintain Runtime Fabric — like myself — to handle upgrades to the Runtime Fabric product that require hardware or even software changes, they can be quite challenging and time consuming. In order to address this, we’ve automated our infrastructure provisioning and management through the use of technologies like Azure Devops. We write our code in shell, python, MuleSoft APIs, CLI tooling and powershell to effectively manage resources in downtime. Very simple things in your scripts make life so much easier and frees up your time to address any upgrades that need to be provisioned quickly.
Automating cluster creation and updates
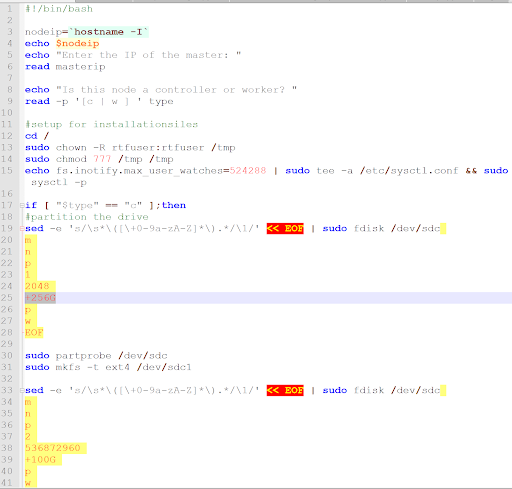
For those who work in Runtime Fabric, you’ll know that creating a cluster can take an entire day of manual work. Maybe you’re trying to figure out what the machine specs are, the differences between the controllers, the workers and the environment details how it needs to join to make sure it’s got all the correct setup. This can take an entire day so the automation we’ve put in place reduces this time maybe down to about 30 minutes, mostly due to sanity checks. It requires little Runtime Fabric or even infrastructure knowledge itself.
The image below is a grab from one of my scripts for a Runtime Fabris creation/update. At BP, we reuse a lot of the same scripts for joining nodes or creating brand new clusters. This works out the configuration a server requires if it’s a controller or a worker. It’s simple ones like partitioning drives or setting notify watches. It’s important to note some of these things have already been addressed in recent Mule updates, but as early adopters we were catching these things and having to put them in ourselves.
Other things that help with upgrades is automating the scaling of replicas for production pods to ensure rolling upgrades/deployments when servers require full reboots. Managing Runtime Fabric software and infrastructure tasks can be quite overwhelming to new joiners and really disastrous if not done right. Knowledge Transfers (KTs) also require a lot of training because developers need at least a basic understanding in the underlying technologies such as Kubernetes or your cloud provider. Moreover, other users will have to be familiar with AWS architecture and simple automations can be very effective to reduce your hands-on time and others in your team who need to manage the platform.
Automating security patches
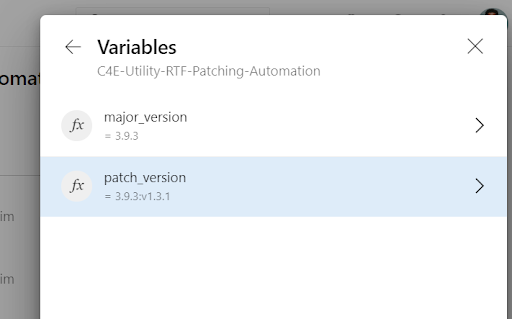
Another thing we found useful is that security issues get issued by MuleSoft and it can also be time consuming. For example, if it requires re-deployments of your applications to specific versions in order to address the patch. Given the scale of some orgs like BP, it can be time consuming and difficult to manage without the automation in place. We’ve addressed this by building pipelines that allow specific applications chosen by a C4E, to be patched to the latest version. We wrote this to address security patches, but it also allows us to ensure that we’re all compliant and running on the same base image of MuleSoft in our platform. This is an added benefit that came out of this. As we have a surplus of data already going to the Splunk platform, we can take our inputs to our Azure devops pipelines from exporting data within our Splunk platform into a CSV file. Then we can patch all of these applications that are running on specific major runtime versions. These patches have been issued several times and after the first, which required most of our C4E team, we’ve reduced it to one person on the team triggering the pipeline. The takeaway here is if you’re doing it once for one of your platforms, it will probably need to be replicated which requires automation and reuse to enhance the experience and save your team time.
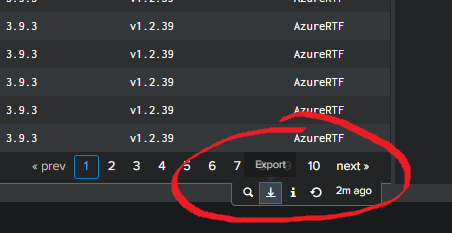
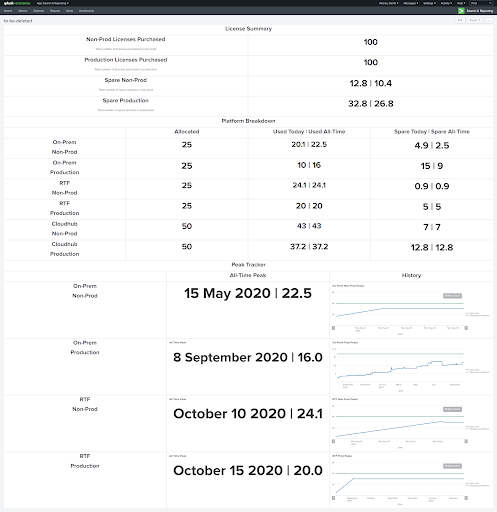
Lastly, when managing a hybrid platform, it’s common to wonder “how do I manage the utilization and allocation of licenses distributed to project teams?” While CloudHub is well-governed, you can view allocation directly from the Runtime manager, other platforms like on-prem and Runtime Fabric, it’s not as simple. Thus, for governing application licenses including memory for infrastructure purposes we manage them through CI/CD pipelines. However, managing license allocation and consumption requires other methods. So BP built Experience and Process APIs to maintain an API layered approach. We also built scripts to add to our Splunk platform for visualization purposes across all Mule options. Tracking on-prem spend alongside Cloudhub for compliance purposes can be achieved using these methods for an overall holistic view.
You can see an example of our dashboard below:
Key takeaways
Overall, by combining out-of-the-box features with Runtime Fabric and the CloudHub offerings with some custom innovations, you can really enhance your user experience to make MuleSoft an easy and smart choice as a platform for your organization. I work with a great team who puts a lot of effort into the work we do using MuleSoft and other features and I hope you learned something from this blog.
If you have any questions, please reach out to me on LinkedIn. The recording of my presentation is available here.


