
Observability is a comprehensive set of capabilities around logging, analytics, monitoring, troubleshooting, and measurement of a system. Here the term system is broadly used to indicate platform, runtimes, and applications. Observability plays a consequential role in providing the real-time pulse of a system. Lacking observability in a system would be similar to flying an aircraft without a fuel indicator.
It’s common to hear phrases like, “You can’t improve, what you can’t measure,” “you can’t analyze if you can’t collect data,” and “you can’t solve unless you troubleshoot” in regards to observability. It’s imperative that all critical systems be built with observability in mind to analyze, measure, troubleshoot and to improve.
Pillars of Observability
Logs, traces, and metrics form the three pillars of observability. They all sound the similar, let’s take a moment to define what they are:
Pillar #1: Logs
Logs are messages logged by an application, system, or OS when an event occurs. It could be an application logging a message at critical stages of a transaction processing or a system logging messages regarding the start and stop of an application or an OS logging user audit messages.
Pillar #2: Metrics
Metrics are measurements. Unlike logs, metrics are logged periodically. For example, a system can send the current CPU or memory state to a collector, a temperature sensor sending periodic temperature readings.
Pillar #3: Traces
Traces — as the name indicates — are clues left behind by a transaction as it flows through different applications across transport and protocol boundaries in distributed systems. Traces weave a complete transaction journey from beginning to end.
Observability in Anypoint Platform
Anypoint Platform consists of a runtime plane and a control plane. The runtime plane is responsible for running the APIs, applications, policies, and runtime services. The control plane is responsible for managing the runtime components. Observables in Anypoint Platform can be split based on runtime and control plane
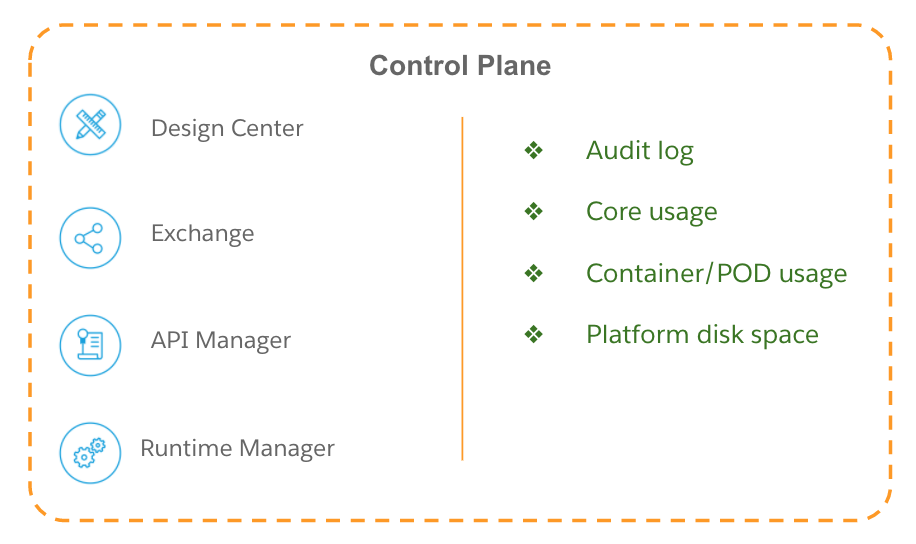
Observables in Anypoint Control plane
Anypoint Platform is offered both as an iPaaS and on-premise solution. Anypoint Platform iPaaS solution is completely hosted and managed by MuleSoft — hence observability is most often handled inside the platform and only certain aspects like audit logs, core usage are exposed to customers which they can use to take appropriate action. The Anypoint on-premise (Private cloud edition) is hosted and managed by customers, thus observability ownership often falls on the customer.
The following diagrams highlight the components in the Anypoint Platform control plane and corresponding observable candidates in those components.
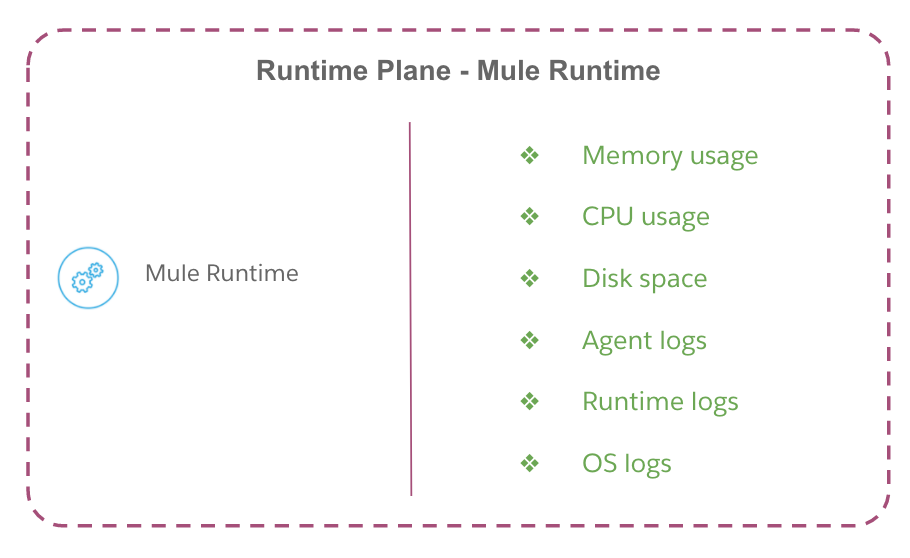
Observables in Anypoint Runtime plane
Anypoint runtime plane comprises Mule runtimes, API, and applications. Anypoint Mule runtime is offered both as iPaaS and on-premise solution. The following diagram lists the runtime server component and corresponding observables as applicable to the runtime component.
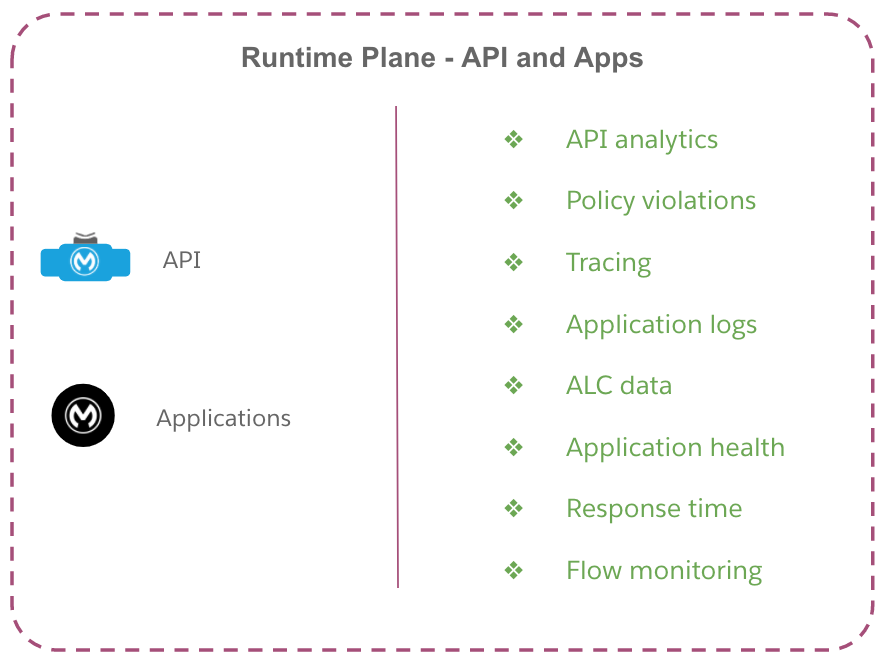
The following diagram indicate the Runtime API and applications and their corresponding observable components:
Matrix of Observables and Deployment Options
In the previous sections, we delved into observables available in Anypoint control plane and runtime plane. But a customer’s deployment choice plays a big role in which observable parameter makes sense for them. Mulesoft Anypoint Platform offers three deployment choices: cloud, hybrid, and private cloud.
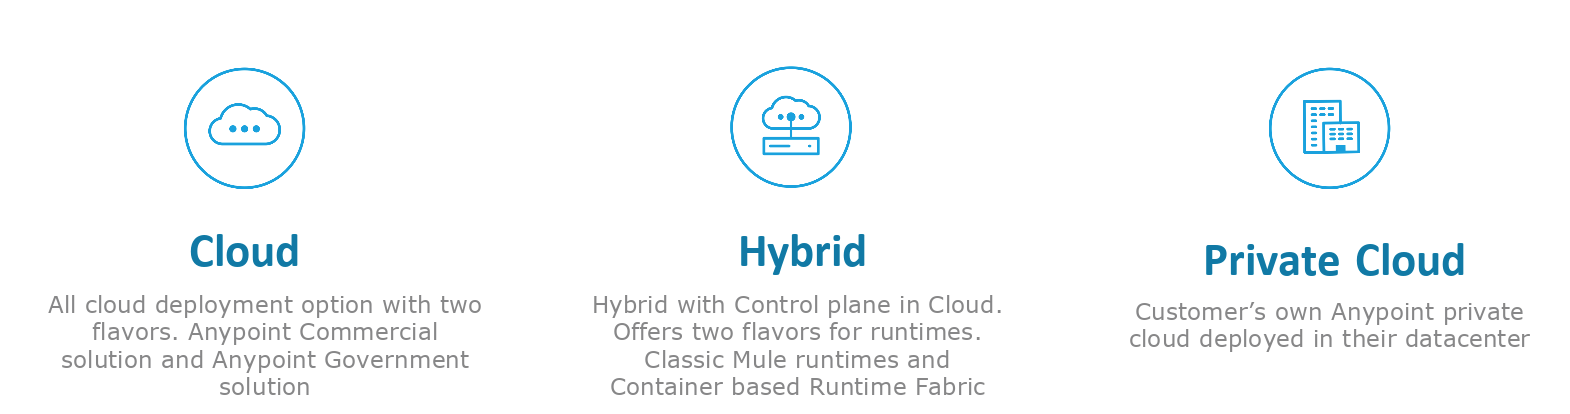
Mulesoft Anypoint Platform offers out-of-the-box support for many of the observables. Depending on the MuleSoft deployment option you choose, some of the observables may be available to you out-of-the-box, and for others you may have to use third-party solutions.
The following matrix highlights the observables which are applicable for a given deployment option, available out-of-the-box and requiring external tooling:
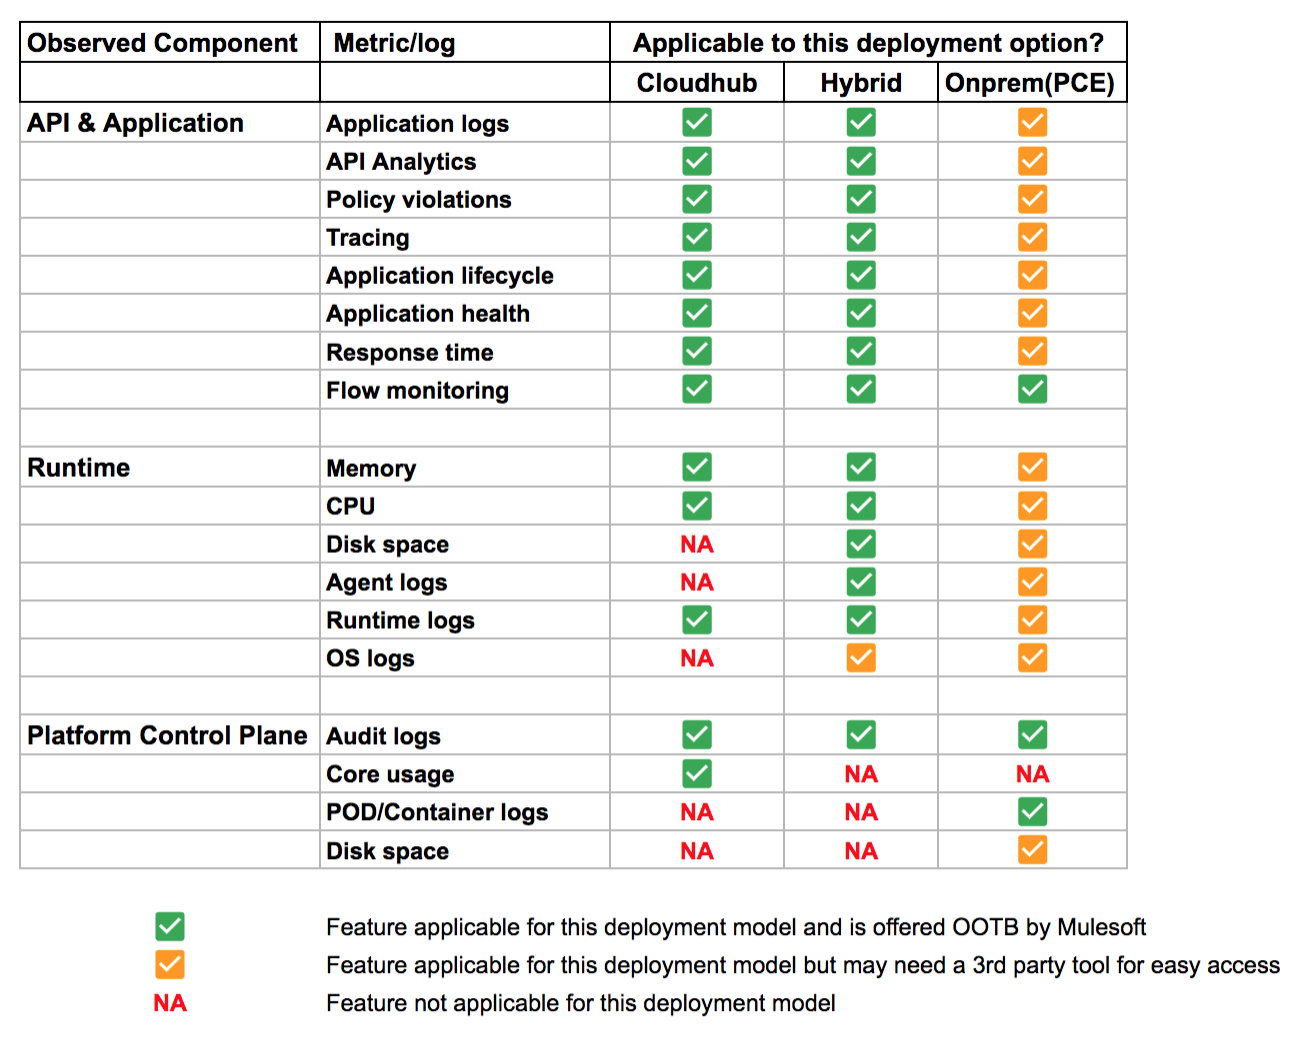
External tools for observability in Anypoint Platform
Anypoint Platform cloud deployment option provides an out-of-the-box solution which addresses almost all of the observability demands of customers. For hybrid and on-premise deployment options, Anypoint Platform provides the right hooks to integrate third-party observable solutions.
Some of the common third-party solutions used are:
- Splunk, ELK & SumoLogic for log aggregation and analysis
- Jaeger, Zipkin for tracing
What’s next?
In our next blog, we will dive into details on configuring the external systems with Anypoint Platform components. For more details on how to ensure a resilient infrastructure and high performance — check out our Anypoint Monitoring offering.


