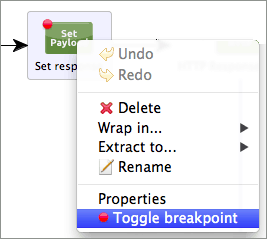
Have you already tried the Visual Flow Debugger? It’s one of the new shiny features that comes with Mule Studio Enterprise 3.4. Well, if you haven’t used it yet, this post is for you:
1. Message Browsing – All the information you ever wanted, now at a click’s distance.
Before Visual Debugger, if you wanted to see the contents of the payload at each point you had to clutter your mule configuration with loggers all over the place, well, those days are over. Just put in a breakpoint et voilà!
You can also edit most values dynamically at runtime by clicking them.
Note: Be careful, what you put in there is not a string, but a Mule expression. Therefore string literals go with quotes (e.g. “a string”)
Tip: If you are looking for the complete message, it’s located in the Variables tab (on the right side). The things we show on the left are the most commonly used elements, the payload and some IDs.

2. Exception breakpoints – Stop browsing huge logs to find the error source.
This functionality is enabled by default, so that when you run in debug mode and there’s an exception somewhere in your flow, it will stop processing at the exception. Studio highlights the stopping point with a red, dotted line.
Before:

3. Conditional breakpoints – Are you picky? Then today’s your lucky day.
Suppose, for example, that you want to isolate one specific case in a really big set. What do you do? Put another Choice component in your flow just to separate it? No way, just apply a conditional breakpoint! Set it with whatever Mule expression you want evaluated and if it evaluates to true, flow execution stops there.
4. Expression evaluation
These come in two flavors:
- Non eco-friendly (popup): Just use and dispose. Open it, evaluate, click somewhere else and they’re gone. Really simple, right? (My personal favorite)
Tip: Use the popup shortcut and navigate with the arrow keys - Collector’s edition: add your expressions to the Mule Expressions pane so that Studio re-evaluates them at each step.
Save time and reduce frustration: give Debugger a try, by downloading Mule Studio.
Access our Mule Documentation for a more in-depth look at the Studio Visual Flow Debugger.


