When an issue arises in production it can be quite daunting to reproduce it in a test environment. Ideally one debugs the live application. But logs don’t tell the whole story. And a severe issue may require the application be taken down. How can it be stopped and debugged at the same time? With Mule composite sources and Mule Management Console (MMC) end-point control you can eat your cake and have it, too.
The composite-source element of a Mule flow can contain one or more inbound end-points. Use one or more for production and any number of others for debugging; then set up the debug end-points to provide detailed visibility into your mule application. MMC can then be used to control which end-points are enabled. With this approach you won’t need to waste time setting up a reproduction environment when problems occur nor will you need to shut down the application to diagnose problems.
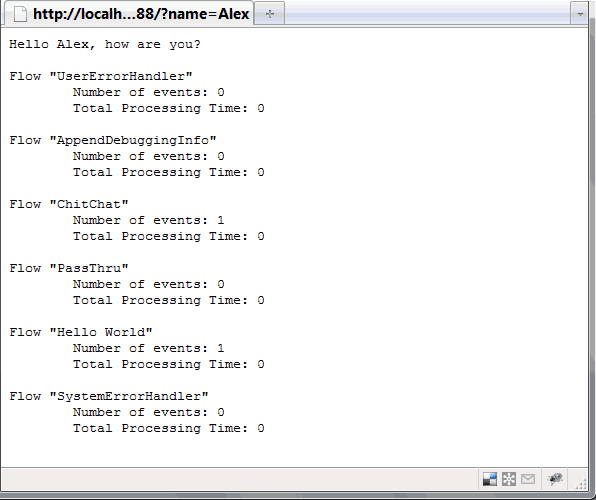
The following example augments the familiar Mule “Hello” example, applying a message-properties-transformer to add a debug flag used to manipulate control logic and application output. Normally the application is run using port 8888. The end-point at 18888, however, applies the transformer to set the debug flag. A choice router in the ChitChat flow routes the message to a debugging component when the flag is detected. This component adds flow statistics to the “Hello” output, shown here:
Below is the message-properties-transformer and composite source. Note the “debug” flag added to the message properties and the alternate endpoint at port 18888 that applies the transformer:
This is the choice router that looks for the debug flag and routes to a debug component when the flag is set:
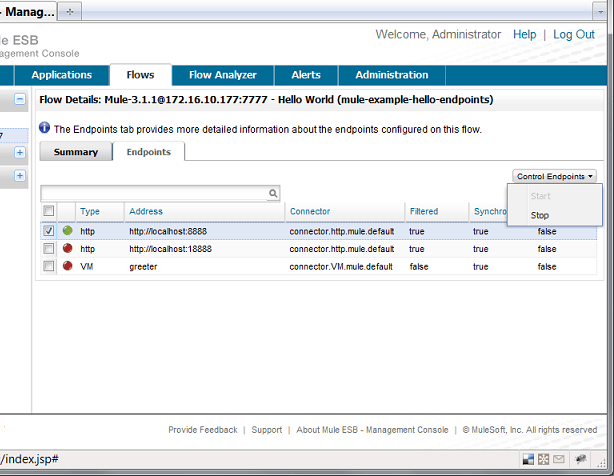
Inbound end-points can be stopped and started using the Mule ESB Management Console. Navigate to the “Flows” tab, select the flow having the application end-points, then click the end-points tab. Select the desired end-point and choose stop (or start) from the pull-down menu.
You don’t have to use the same connector type for inbound end-points. A common scenario is to use a JMS inbound-endpoint for debugging.
The Mule ESB Management Console already provides deep runtime diagnostic capability. Leveraging Mule composite sources and MMC end-point control further enhances diagnostic flexibility and power, with the potential to significantly reduce support turn-around time.
You can find the full Mule configuration along with the rest of the example code here.