
To ensure the reliability and stability of your services, it is essential that you understand the state of your infrastructure and systems. CloudHub 2.0 is a fully managed, containerized cloud service, where you can deploy and run MuleSoft applications.
MuleSoft provides three subscription tiers: Gold, Platinum, and Titanium. MuleSoft customers are automatically enabled to monitor their applications. Titanium customers can avail more advanced monitoring features such as greater storage, and advanced features that offer greater control and flexibility. In this article, we will discuss the various monitoring options available for applications deployed on CloudHub 2.0.
Anypoint Monitoring
Anypoint Monitoring provides an integrated experience of application performance monitoring and log management with insights into dependencies and diagnostics capabilities out-of-box. It gives granular visibility into applications across the application network and the ability to monitor application performance, troubleshoot, and effectively manage application availability.
Dashboards
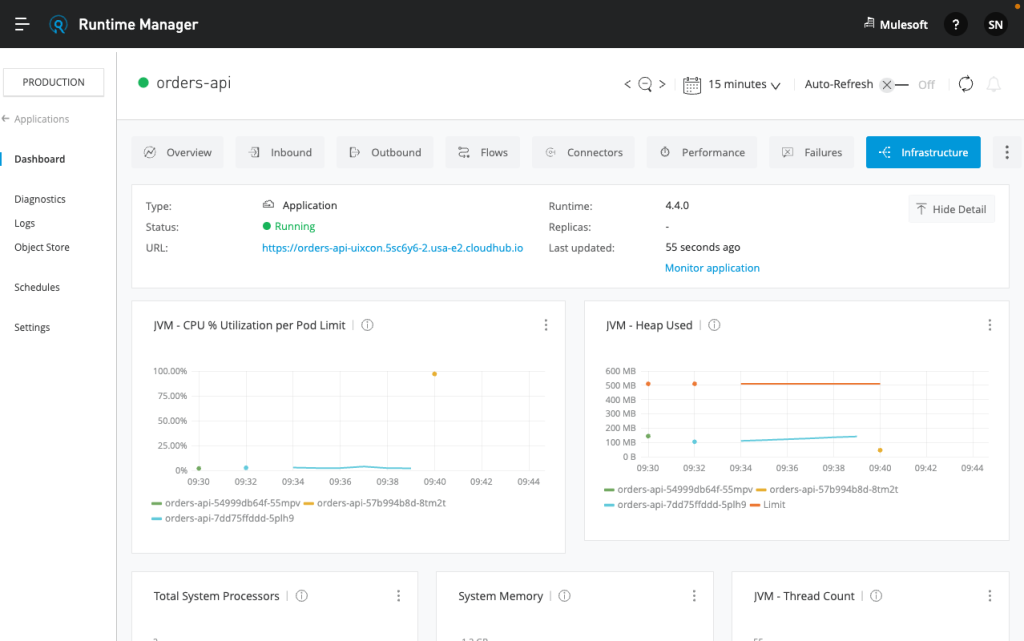
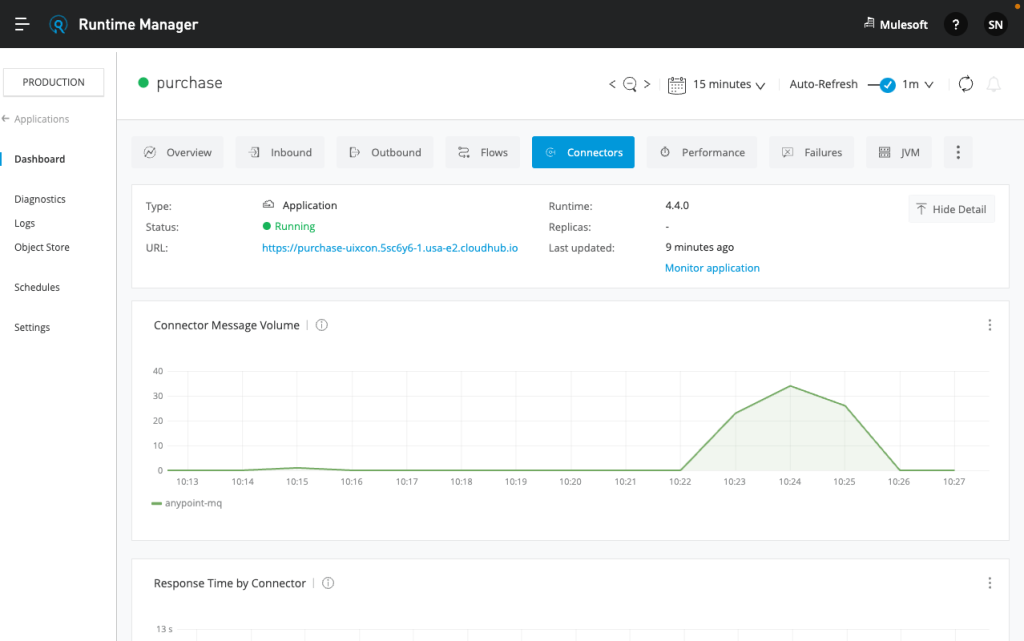
Anypoint’s monitoring dashboards provide visual representations of the resources to detect anomalies, troubleshoot issues, and visualize trends that are not obvious in raw form. By default, Anypoint Platform provides built-in dashboards that provide more than 80 metrics covering everything from Inbound, Outbound, Performance, Failures, JVM, and Infrastructure metrics.
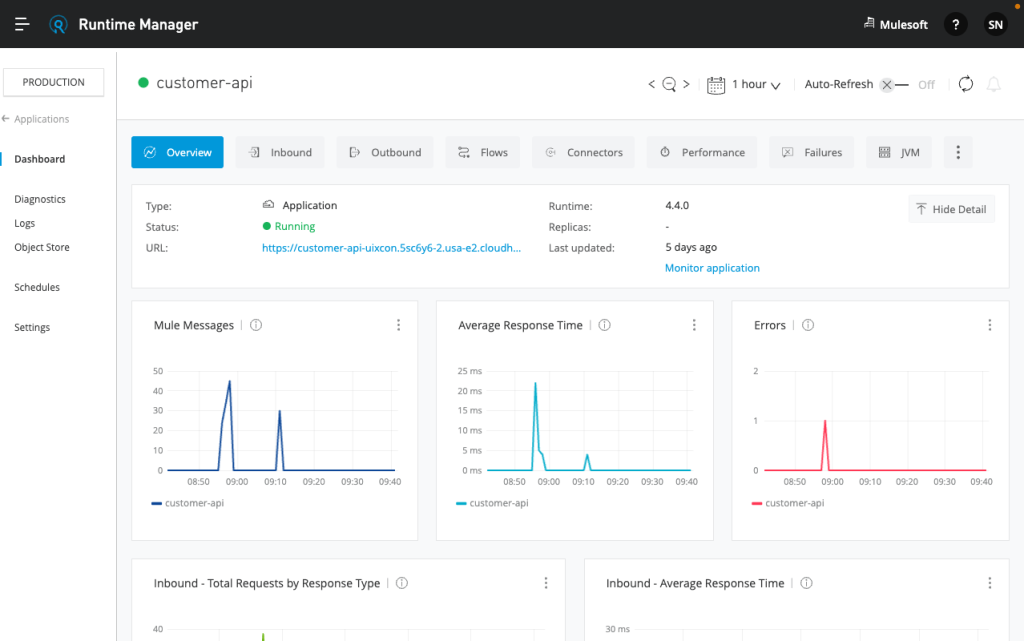
Additionally, Anypoint Platform also provides the ability to create custom dashboards to capture important metrics and data points to identify trends and perform comparative analysis. Customers can leverage the advanced query builder to search for the relevant pieces of data, and customize the visual representation of their charts.

Titanium customers also have additional access to advanced metrics for Inbound and Outbound charts, Flows charts, and Connectors charts.
Logging system
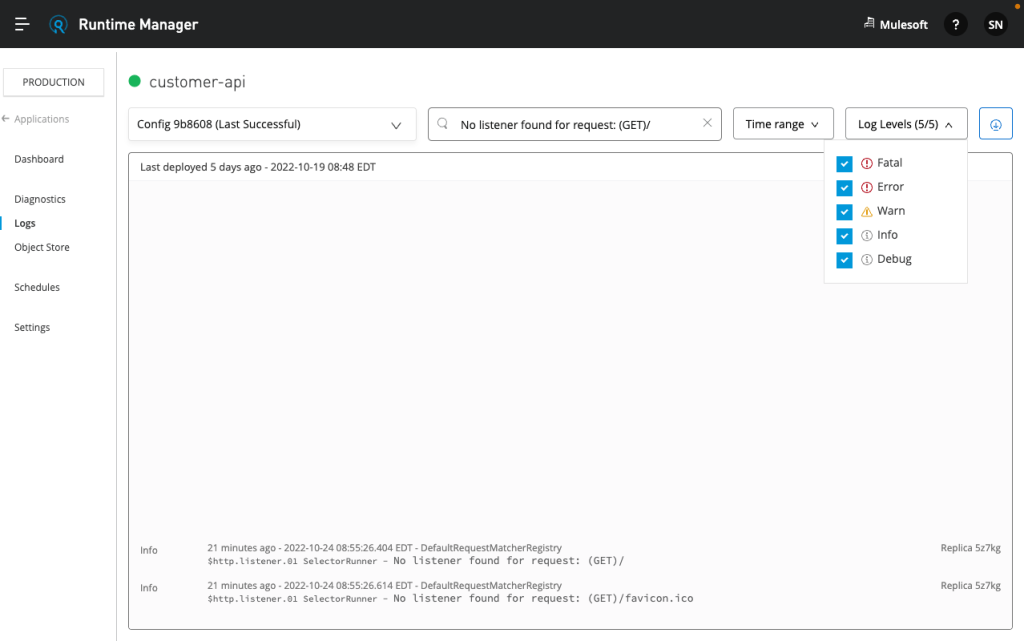
Anypoint monitoring provides both application logs and distributed log management that enables customers to pinpoint issues and extract insights. CloudHub 2.0, provides access to log data, including deployment messages and events for every replica and Mule runtime engine logs. CloudHub 2.0 stores up to 100 MB of log data per application, or up to 30 days, by default. Titanium customers receive more robust data retention and feature limits.
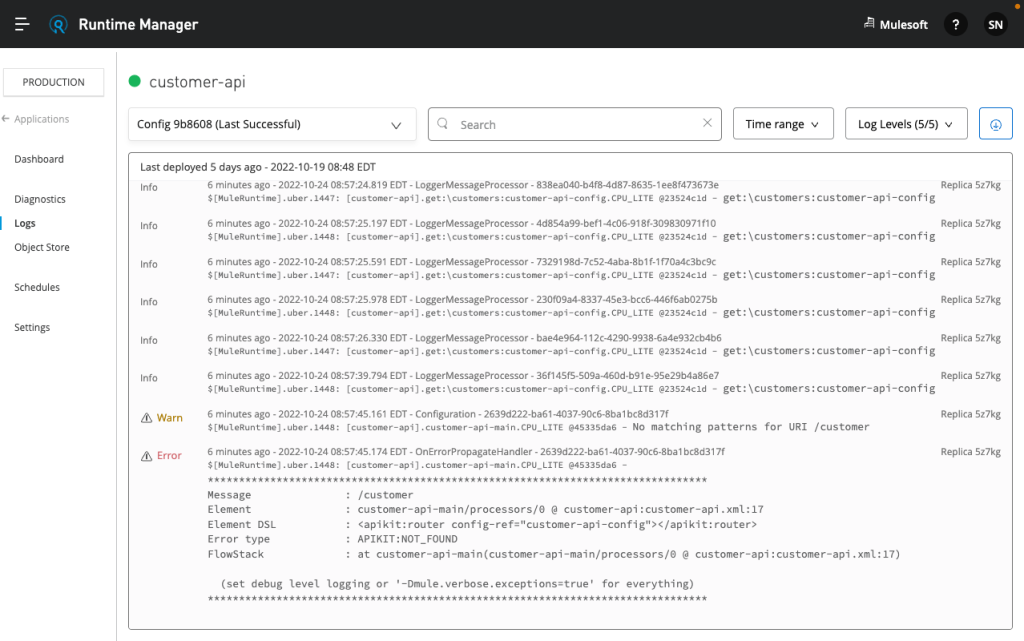
Log results can be filtered based on configuration, replica, log time, and log level. It is also possible to search through the logs with specific filter criteria or by correlationID.
For customers with a Titanium subscription, Anypoint Monitoring also provides a way to aggregate log files for management and analysis. The Log Management page aggregates logs to help identify issues and investigate failures quickly. Additionally, with CloudHub 2.0 it is also possible to access the ingress load balancer logs, for troubleshooting purposes.
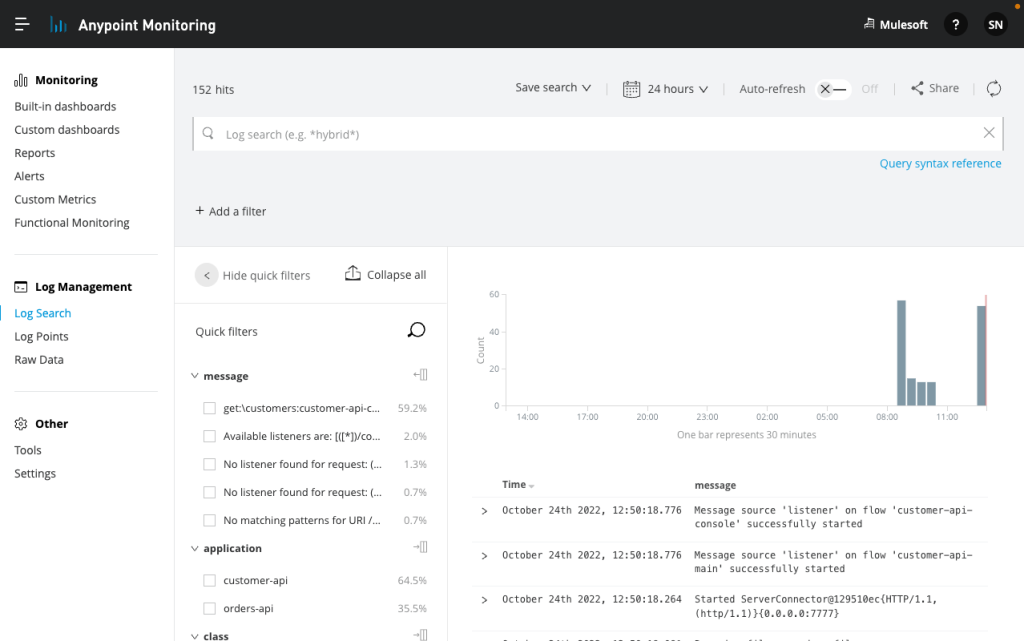
Customers can also utilize REST APIs to archive the log messages to permanent storage for long-term purposes. Additionally, they also have access to the Log Points feature, which allows users to generate logs for applications in real-time without writing code.
Diagnostic data
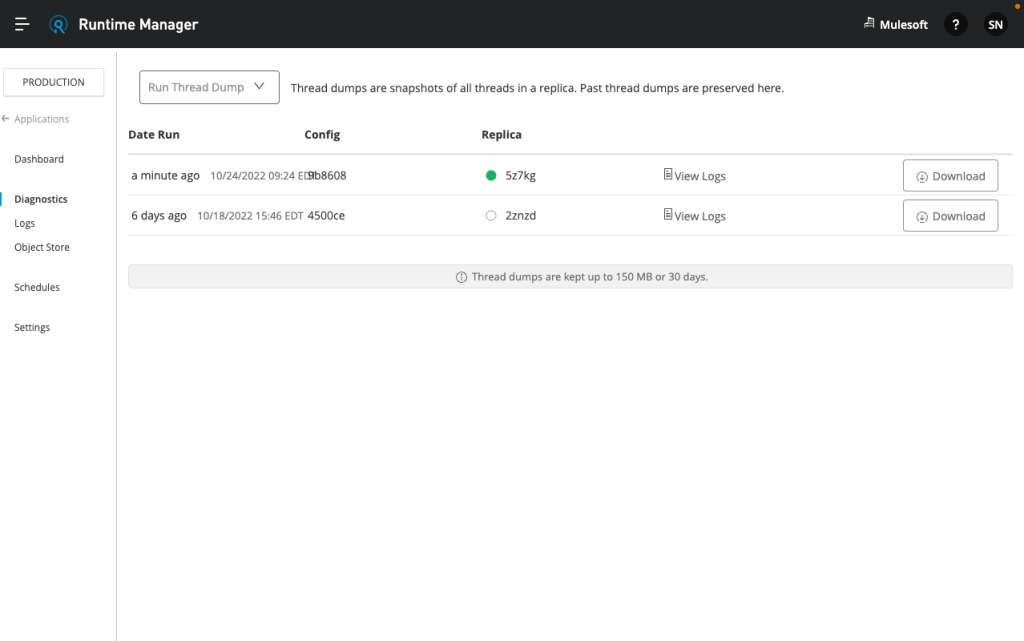
MuleSoft’s Anypoint Platform provides the ability to run thread dumps, which is a snapshot of all the threads in a replica. A thread dump shows the current state of the server, which is useful for debugging and support. CloudHub 2.0 runs the thread dump and displays the latest at the top of the list. It is also possible to view logs for a deployment and replica associated with the thread dump.
Alerts
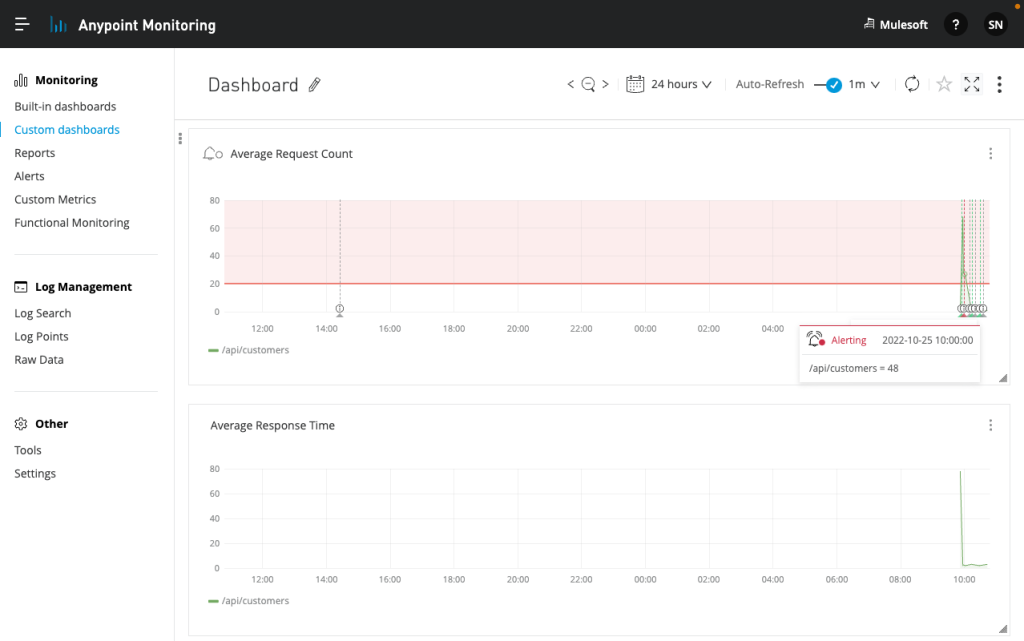
Anypoint Monitoring combines best-in-class performance monitoring with enterprise alerting capabilities. Customers can create alerts they need in order to get notifications on critical problems. It’s also possible to set up notifications as applications approach infrastructure capacity, allowing users to proactively manage problems before they arise. Alerts can be set up to trigger email notifications when a metric that is measured passes a specified threshold.
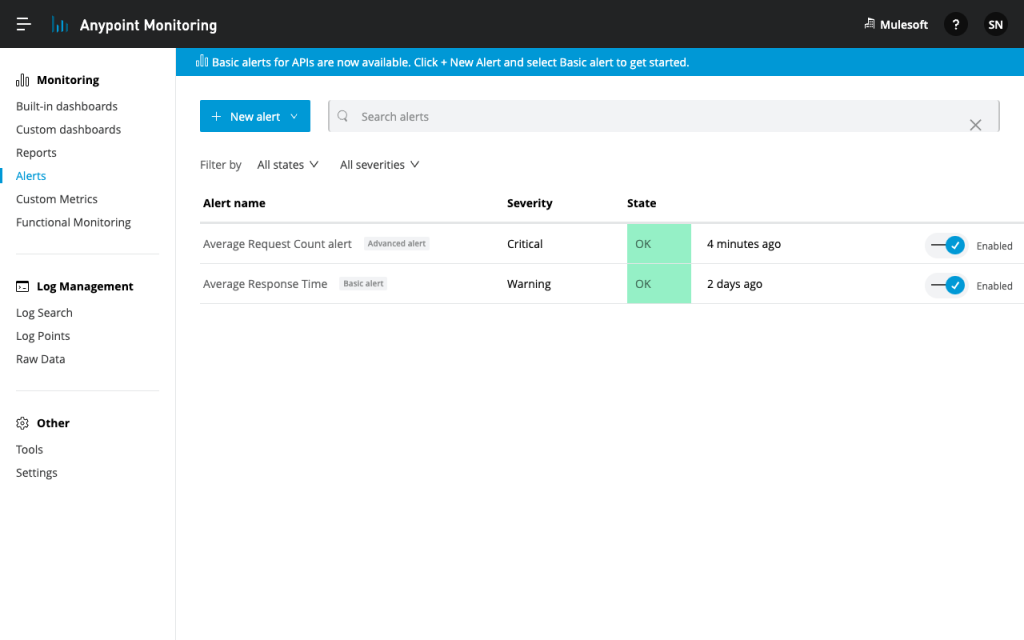
Additionally, Titanium users also have the ability to set up alerts on custom dashboards based on the existing query conditions. For instance, notice the alert condition setup on the Average Request Count widget.
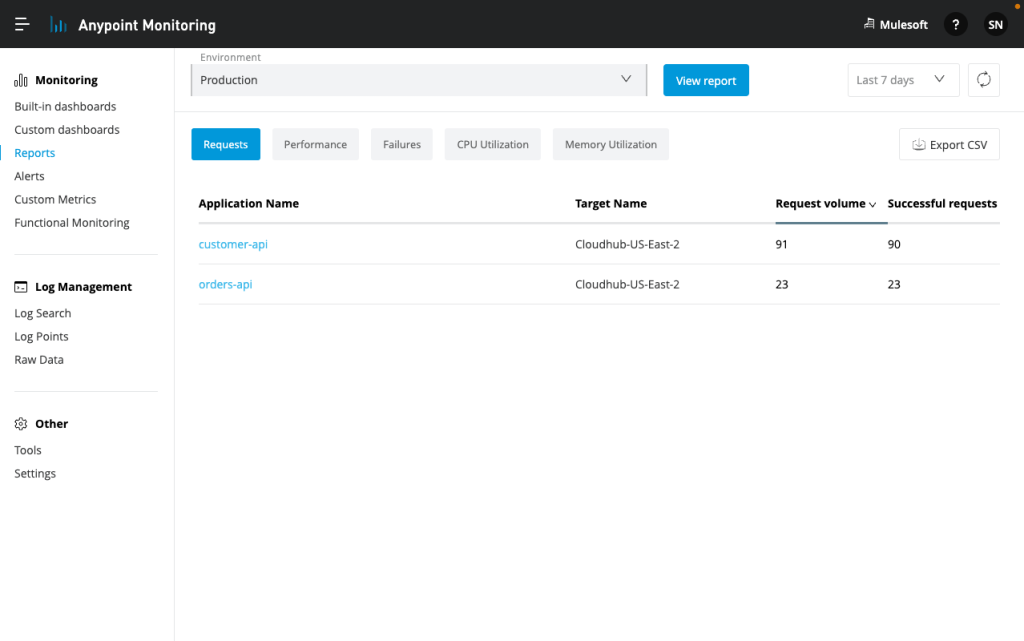
Reports
Titanium customers have the ability to view the list of applications running in an environment using the Reports page. Reports display information about overall performance and behavior across all the applications in the environment. These reports can help in identifying performance and availability problems to maintain the expected level of service for the applications.
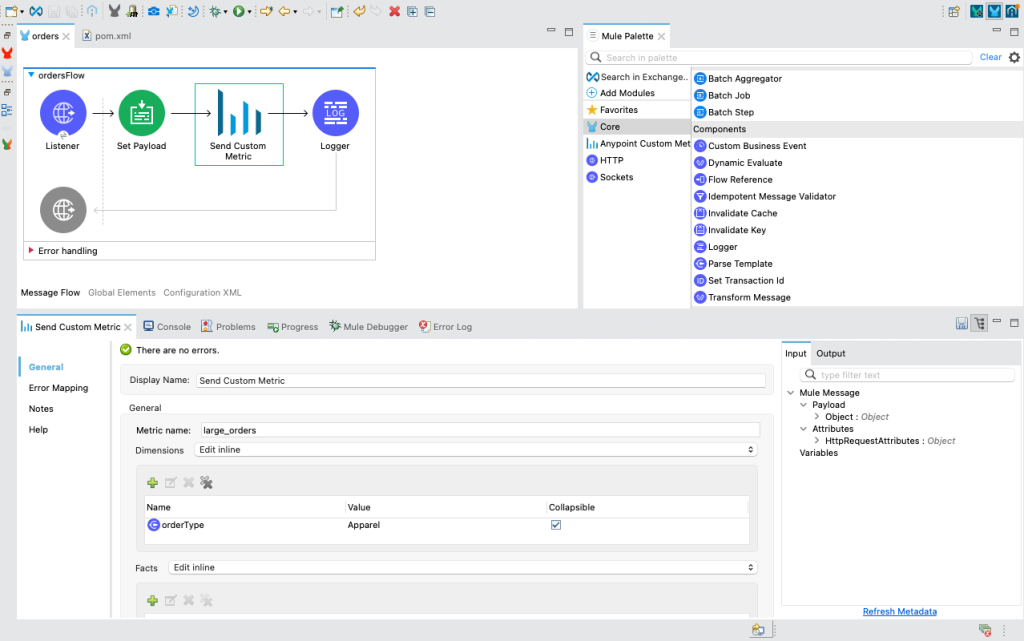
Custom Metrics
The Anypoint Custom Metrics connector provides the ability to send operational and business metric values that can be defined from an application to Anypoint Monitoring. Users can then use the built-in custom metrics dashboard to visualize the data. For instance, a customer would want to track large orders as they come in, defining a business metric allows them to keep track of this in real time.
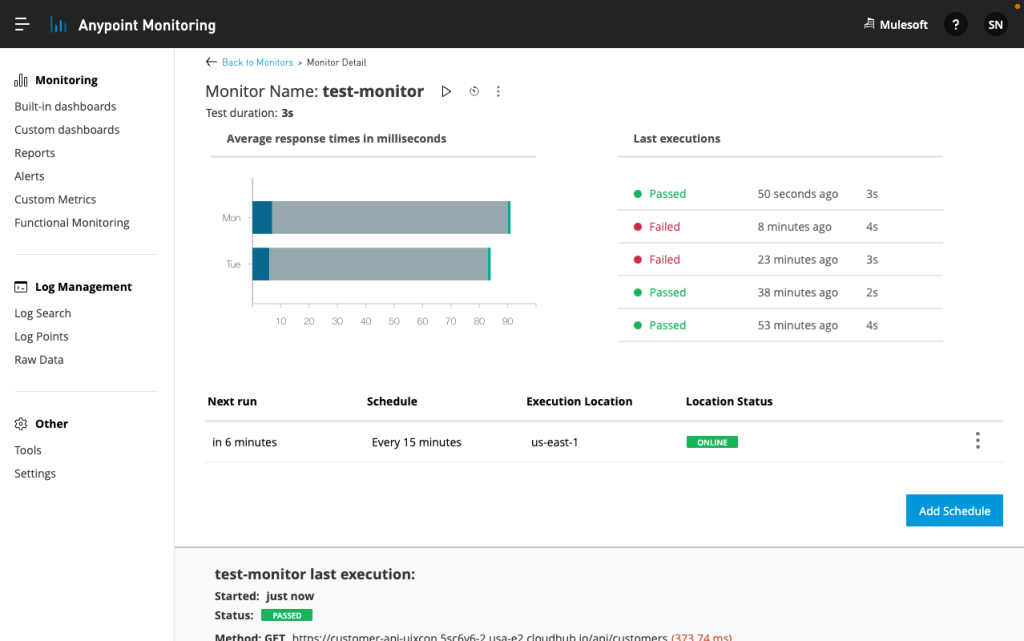
API Functional Monitoring
API Functional Monitoring is a framework for assuring the quality and reliability of public and private APIs that are being used in application networks. With API Functional Monitoring, customers can consistently test the functional behavior and performance of APIs throughout their API lifecycle, in testing and production environments. The solution helps customers carry out White-box, Black-box, and Runtime monitoring testing to ensure the quality of the APIs.
Third-party monitoring
For organizations using other monitoring tools, it is also possible to set up log forwarding to provide a holistic view of the environment. Monitoring tools like Splunk and ELK can be used for monitoring and alerting capabilities to augment the Anypoint Monitoring capabilities. It is possible to integrate CloudHub 2.0 application with an external monitoring tool by using a custom log appender.
Summary
With the rich set of monitoring tools; operations, and development teams can quickly diagnose issues using aggregated metrics, data visualization tools, alerts for issues, and a log aggregation system for applications deployed on CloudHub 2.0.


