
In my last blog, I introduced terminology that can be used to label common concepts and patterns in the realm of digital integration. My intent was to get architects on the same page when it comes to designing and understanding highly-integrated, complex software systems that are common in most 21st century enterprises. A lack of understanding of what existing systems do and how future systems should be designed is a major reason that software initiatives go too long, are too expensive, and sometimes just outright fail. This blog attacks that problem further, by introducing a visual language to put those concepts into practice.
Software system diagrams are fraught with problems. They try to stuff too much information onto one page. In spite of this, they often omit vital information. And to top it all off, without a link to the software system itself, they are frequently inaccurate and go quickly out of date. I would like to tackle that last issue in the future, but for this blog I will focus on killing the first two birds with one stone. Specifically, how can we visually capture the right information — and only the right information — on one page when it comes to designing the integration of digital systems?
NOTE: For a comprehensive look into the field of software architecture visualization, I recommend the work of Ruth Malan and Simon Brown.
The importance of “and”
One of my favorite books of all time is “Thinking in Systems: A Primer,” by Donella Meadows. I did a whole O’Reilly Software Architecture Conference talk on it. A memorable quote in the book is the following:
You think that because you understand “one” that you must therefore understand “two” because one and one make two. But you forget that you must also understand “and.”
Donella Meadows
This gets to the heart of the issue with many software diagrams when it comes to integration. Components in a system are often over-specified while the interactions between them are under-specified. Since “the greatest leverage in system architecting is at the interfaces” — another quote I beat to death — it is vital that we focus on the lines in our integration architecture diagrams, and not just the boxes. In my prior blog, I explore types and patterns of digital system interactions. Let’s revisit those interaction primitives, this time with a visual identifier for each. Here are the icons we can use to identify interaction Types:
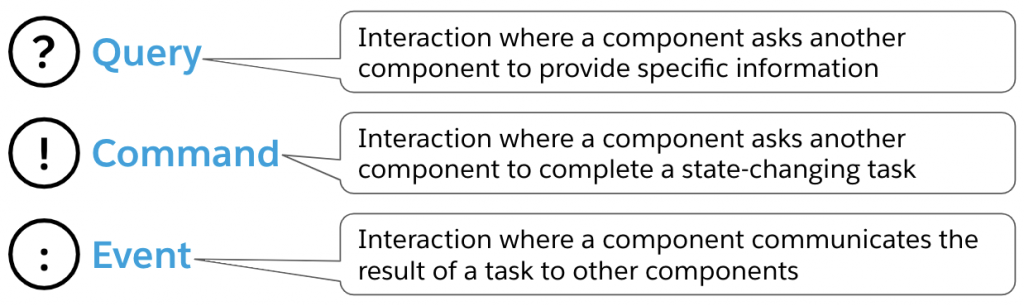
We can use these simple punctuation marks to label interactions in our system diagrams that indicate what type of interaction is taking place. Furthermore, instead of using generic lines to connect boxes and shapes in our diagrams, we can use the presence of arrowheads and curvature of connectors to designate interaction patterns:
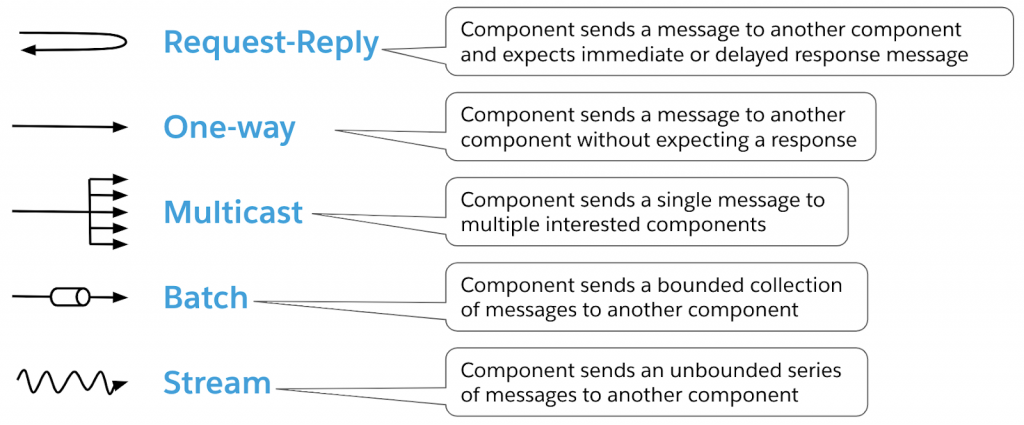
We can enrich our software system diagrams using this visual interaction metadata. These symbols allow us to construct diagrams that focus explicitly on the communication between components of the architecture. Zeroing in on this level of abstraction allows architects to tackle the problem space without being distracted by implementation technologies that are irrelevant at this stage. The most fundamental structure of these complex software systems is defined by the underlying business capabilities and how they interact. This structure will have the most impact down the line on the evolvability of the system and its relationship to the supporting organization. Now let’s illustrate this approach with an example.
A simple view of a complex system
For a few years, I’ve been using a fictional banking example to illustrate various techniques in domain-driven design, microservice architecture, and API-led connectivity. Let’s imagine a bank that wants to offer a payment service that allows their customers to be approved based on their full relationship with the bank, rather than just basing it on the funds they have available on their card or in their account. The flexibility extends beyond the authorization decision, and also allows them to fulfill payments at a later date. So a customer could make an interest free purchase on the 9th day of the month, and have their account debited on the 15th when they get paid. It sounds like a straightforward service offering, but the digital solution involves a fair amount of complexity.
To implement the software solution for this scenario, a number of business capabilities would be required:
- A Payments API that can be integrated by merchants for mobile and web commerce.
- A Customer Authentication service.
- A Payments Authorization service to determine whether or not transactions should be approved.
- A Customer Risk Scoring service to rate a customer’s worthiness for approval based on their current status with the bank.
- A Payment Fulfillment service to credit or debit customer accounts and payment instruments.
- Product Proxy services to handle communication with legacy account, card, and other product systems.
- A Product Monitor service to poll product systems for new customer activity.
These components are illustrated in Figure 1:
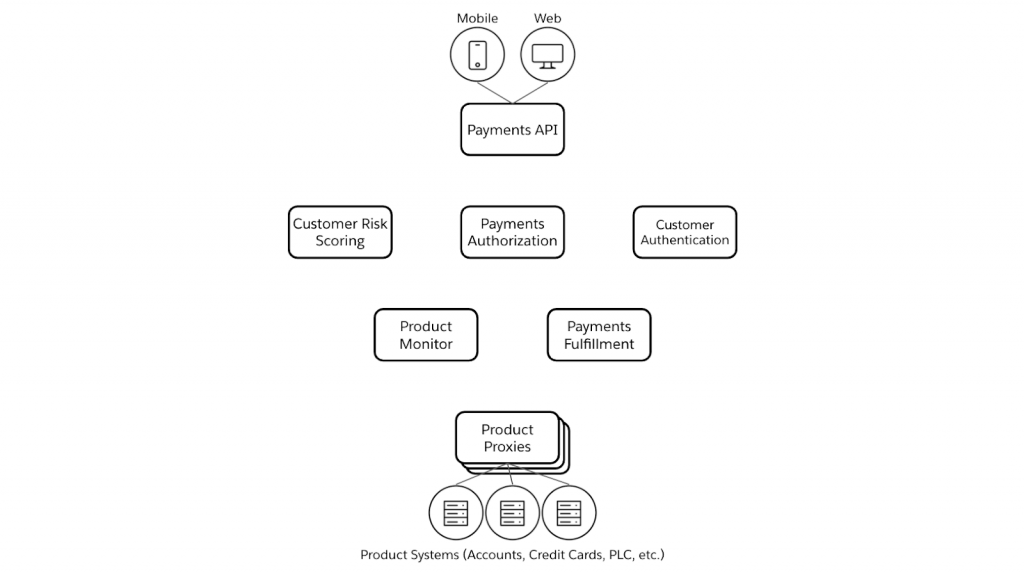
Figure 1: Components in a flexible, customer-centric payments offering.
There could be plenty of discussion on whether these are the right components, and the process that was used to derive them, but the focus of this blog is to show how they can be integrated to deliver the payment solution. We’ll break it down into three parts: scoring a customer, authorizing a transaction, and fulfilling a transaction.
Keeping score
What will ultimately drive the success or failure of this payment offering is how effectively customers can be scored for authorization. If the bank can be precise with their scoring, they will drastically reduce their resulting financial risk, and thereby offer the service at an affordable price for customers. Precision will be driven by the volume and currency of the customer data they can ingest into the Customer Risk Scoring service. Data from the customer’s deposit accounts, credit cards, lines of credit, even their mortgage and investments will all be helpful here. In fact, the Product Monitor service has been included specifically to continuously query data from the legacy product systems and then stream it to the Customer Risk Scoring service. These two interactions are depicted in Figure 2.
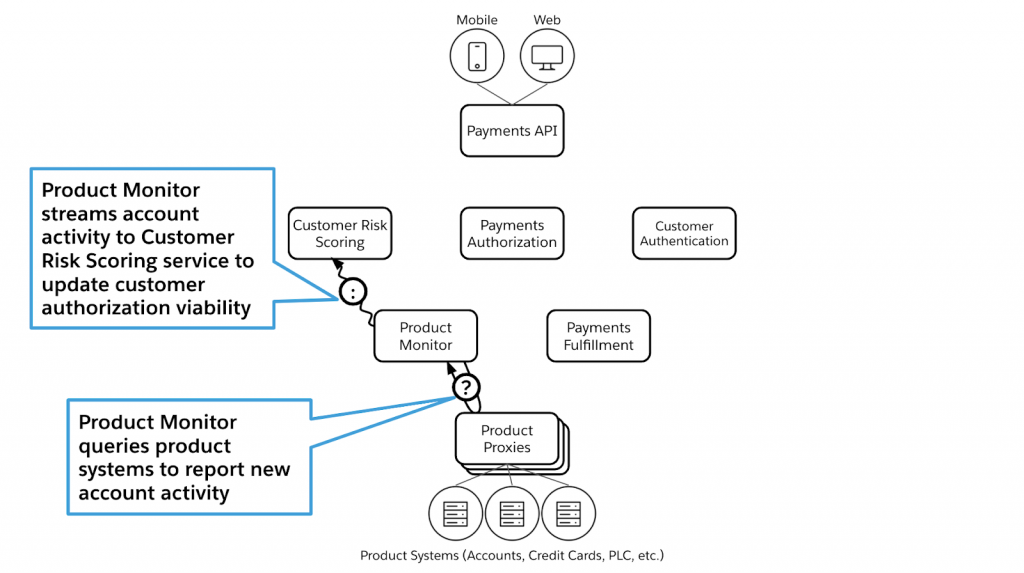
Figure 2: Interactions to support customer risk scoring.
Seeking approval
With customer risk scores in place, let’s look at how payment requests flow. These requests are received through the Payments API. Before proceeding, the customer must be authenticated. Once authenticated, the API component would send the payment request to the Payments Authorization service, which would query the Customer Risk Scoring service to make the authorization decision. In some cases, the end user might access the API through multiple user-initiated actions. In this situation, the Customer Authentication service could emit an event notifying interested services — including the Payments Authorization service — that this particular customer is online. Then the Customer Authentication service could proactively query the Customer Risk Scoring service and cache the data, thereby reducing the latency of the authorization request. The payment authorization flow is depicted in Figure 3.
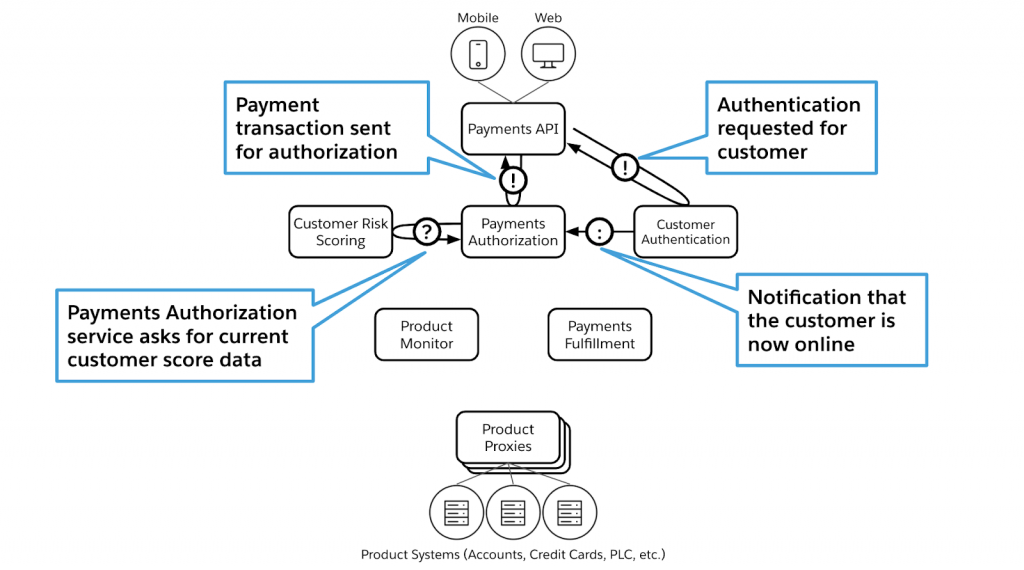
Figure 3: Interactions to support payment authorization.
Finding fulfillment
The final set of interactions show how payment transactions can be fulfilled. To support the movement of money, the Payments Authorization service must publish an event that includes information about the customer, the transaction, the intended fulfillment data, as well as the target account. This gets consumed and stored by the Payments Fulfillment service. Each day, this service creates a batch of approved transactions that are sent to the legacy product systems through their respective Product Proxy services. The transaction fulfillment flow is shown in Figure 4.
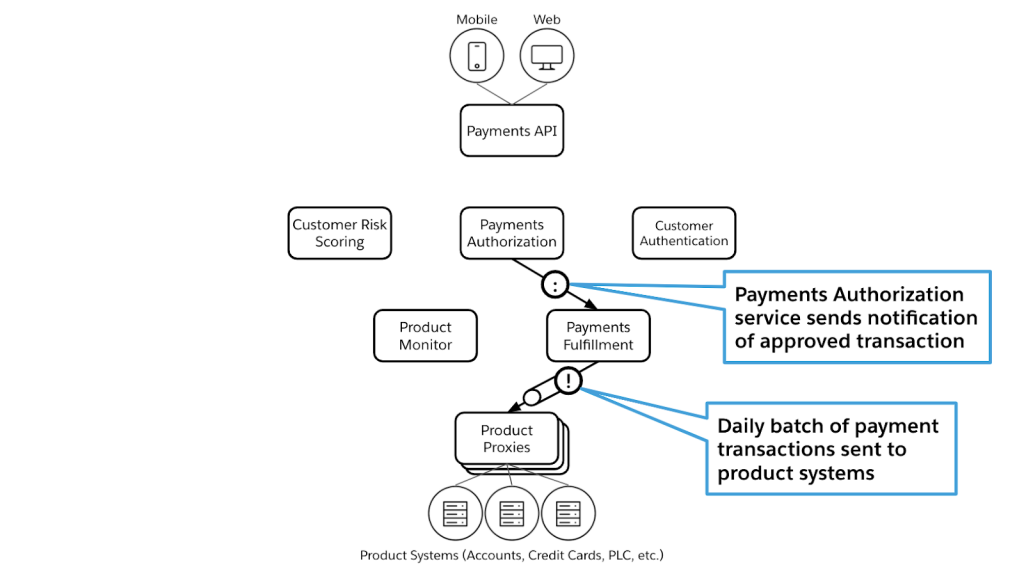
Figure 4: Interactions to support transaction fulfillment.
A picture is worth a thousand words
Overlaying the three scenarios, we now have the picture shown in Figure 5. Without worrying about what language is used to write these services, what protocols are used to deliver data, or in which cloud platforms the system may reside, we have boiled this digital solution down to its essence. Seeing the integrated system as a set of business capabilities, and especially seeing how they need to communicate, we can now make good decisions not only about what technologies should be used to implement the solution, but also about critical operational and organizational considerations.
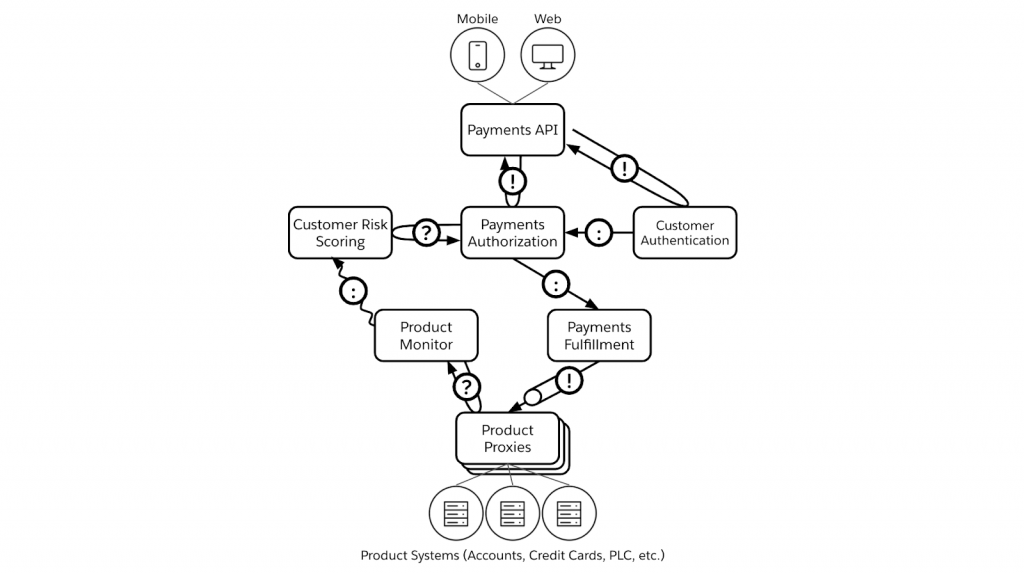
Figure 5: The complete set of interactions in a flexible, customer-centric payments offering.
This blog series boils digital integration down to first principles. There are many trajectories it can take from here. Future posts will explore the process of determining components in more detail. We will also look into compositional patterns in interactions. But it all starts here. It is vital to understand the core concepts of integration. It is challenging to abstract them from their implementation-specific instantiations. Nonetheless, doing so is as important to integration designers as a mathematician learning that one and one make two.
Learn more about the world’s leading integration platform: Anypoint Platform.


