The August 2015 Update 2 of Anypoint Platform features v1.2 of Anypoint Runtime Manager which enables users to monitor and analyze applications running in the cloud or on-premises, in a sandbox, staging or production environment with ease using popular monitoring tools like Splunk and ELK. This gives the users a unified view of all their applications, no matter where they are running.
Monitoring/analytics for On-Prem users
Users of Anypoint Platform – iPaaS have been able to leverage Insight (business events), logs, alerts, messaging, etc to monitor their applications. With this release, on-prem users can leverage similar features and functionality by integrating with third party monitoring tools. This can be done seamlessly with our brand new out of the box Plugins for Splunk & ELK, which simplifies the experience. Users can send vital event notifications such as business events and API metrics, to a system of their choice, which enables them to have a unified monitoring view of their systems.

The purpose of this demo is to display how you can configure and use your third party integration systems, such as Splunk and ELK, with ease. In the examples below we will step through how to integrate with Splunk and create visualizations for a custom business transaction or event.
Integrating with MuleSoft Plugin for Splunk
MuleSoft enables users to seamlessly integrate into their Splunk instances, using our Splunk plug-in, in 2 easy steps.
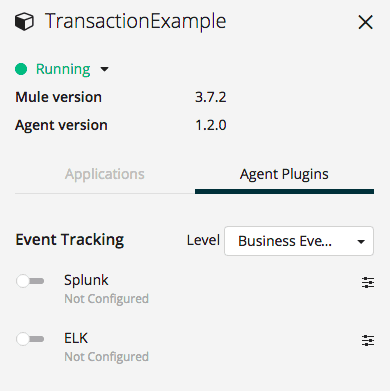
Step 1: Login to your Anypoint Platform account and click on a server that you’d like to configure. The server will need to be up and running and have a deployed application.

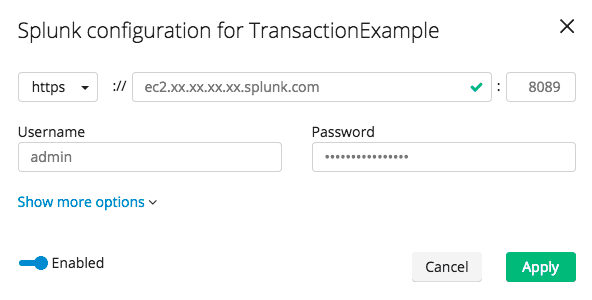
Step 2: Enable Splunk, enter your credentials, and click apply.

The video below steps through how to integrate your system in Splunk and test a transaction.
Tracking Custom Business Events on Splunk
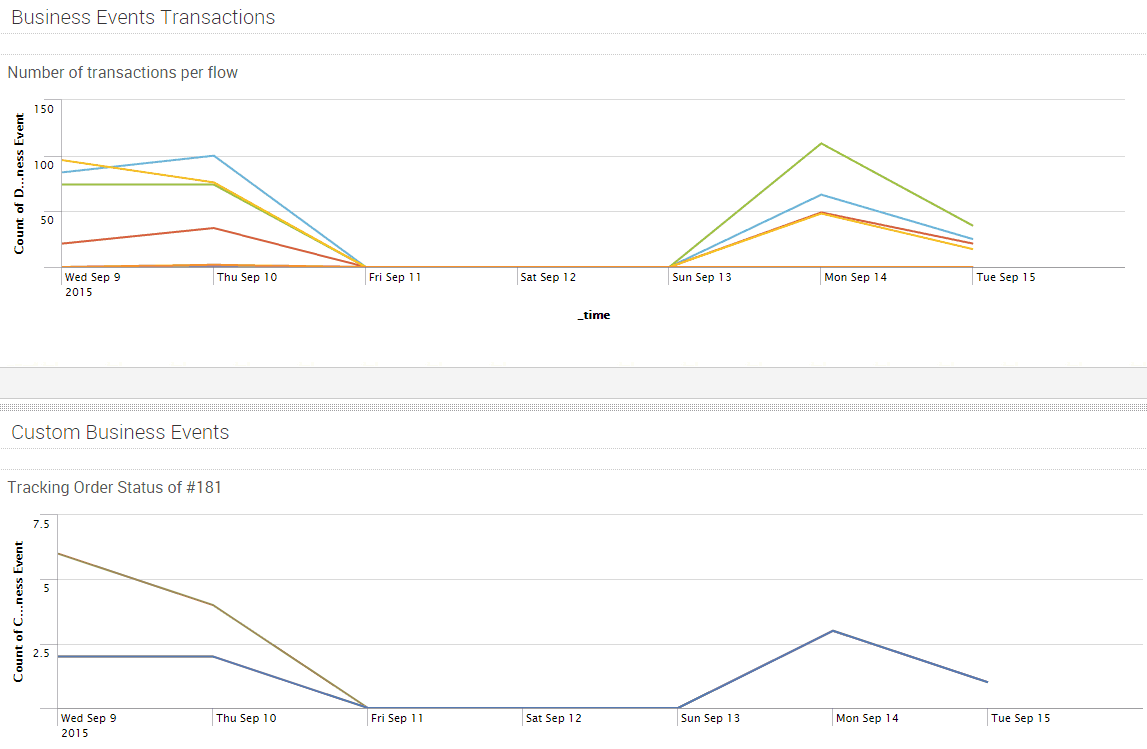
Once the user configures their system for Splunk in Anypoint Runtime Manager, messages from an on-premises Mule runtime will start populating in Splunk. The user has the flexibility to generate reports, create standard and custom dashboards, track business events, etc. In the screenshot below, the first graph shows a visualization of the number of transactions/business events generated per each custom Mule flow created by the customer. The graph below it demonstrates the ability to pick a specific transaction and monitor its path.

For more information and examples check out the links posted below:
Documentation Links:
Click here for documentation on using the product.
Click here for release notes.


