There’s no need to state the importance of debuggers for developers, and Mule developers are no exception. The goal of this blog post is to provide you with a few handy tips for debugging your custom Java code in Mule Studio.
Getting started
I will assume you have already created your Studio Project and added a custom Java class (a Transformer, Module, etc.). If you are not there yet, you should probably read Getting Started with Mule Studio.
Adding breakpoints
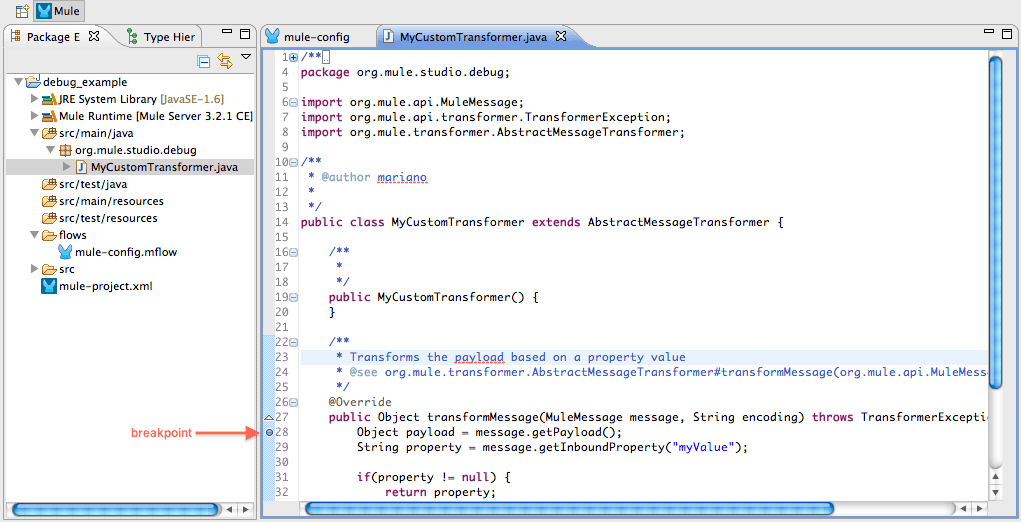
A breakpoint is a mark in your code that will tell the debugger to pause execution and give step-by-step control to the developer. To define a breakpoint in Mule Studio, you simply double-click the left margin of your Java class at the same height of the line where you want execution to stop. You should see a small blueish circle in the margin (tip: if you right click the circle, you will find additional configuration options):
Running your Mule application in debug mode
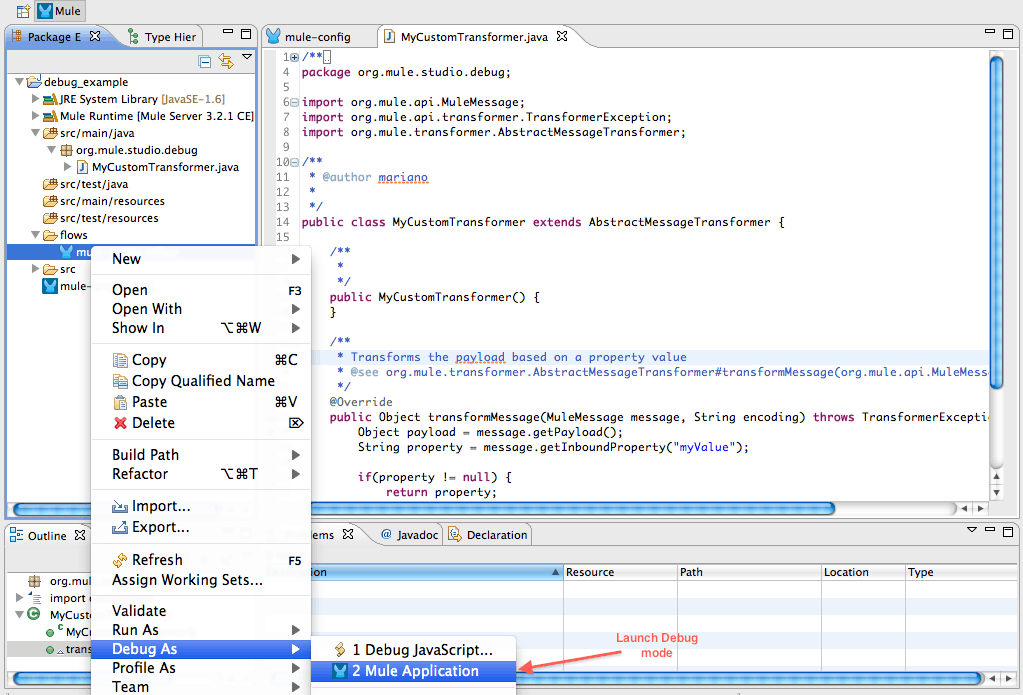
The only thing you need to do now is launch your Mule application in debug mode. To do so, just follow these steps:
- Right click on your Mule config file
- Go to Debug As -> Mule Application
Debugging
Your application will start running. When the breakpoint is reached, execution will be paused and you will be switched to the Debug view. You will then have the control to execute your code step by step (F6 to step over and F5 to step into your code, are shortcuts that help).
Hope these tips help you debug your Mule Application much more easily. I would love to hear from you if you have any other Studio tips that you want to share with our Community!


