
In the digitalization era, “data is the new bacon.” What does this mean? Data can be served in different ways just like bacon and can be used in different ways by different audiences. It also makes food taste better, that is how data can be used to make businesses better and efficient.
Data is only powerful if you understand the information coming out of it. In order to understand it we need simple and informative data visualizations and why is data visualization so important? The answer is because it’s easier to understand summarized data in pictorial form than going through large tables and logs of information. For example, logs coming out of a simple order creation API can help engineering teams track success/failed transactions or help business teams to evaluate the sales, profits and focus areas. To achieve above goals we just need to represent the same data in different formats such as bar graphs, tables, pie charts, etc. depending on the purpose and the audience.
There are dozens of data visualizations tools out there — and thankfully, MuleSoft integrates with nearly all of them. Today, I will talk about how easy it is to send data from your MuleSoft APIs to New Relic Insights.
What is New Relic Insights:
New Relic Insights is an analytics tool that queries and visualizes data to make it more understandable from a business perspective. This tool builds a number of KPIs from Mule application data into New Relic.
New Relic Insights can be useful in the following ways:
- Create and run NRQL (New Relic Query Language) to get results by querying the logs.
- Generate real-time dashboards.
- Package the above dashboards to New Relic data apps.
For more information visit New Relic Insights documentation.
Connecting to New Relic Insights Events API:
New Relic has a set of products like APM, browser, infrastructure, mobile, and synthetics. All these products are monitoring tools for different types of platforms. The products come with an agent that can transfer data to New Relic Insights. We can also leverage the REST API to send data directly to Insights. This article focuses on using New Relic Insights REST API called Events Collector API. Below are the details of what all information is required for sending data.
Host Name: https://insights-collector.newrelic.com/v1/accounts/{accountId}/events
Method: POST
URI Params:
- accountId – New Relic Insights account Id (follow the instructions below)
Headers:
- X-Insert-Key – Insights Insert Key (Follow the instructions below)
Follow these steps to get accountId and insert key:
- Login or create a New Relic account (Trial Version)
- Go to insights.newrelic.com > Manage data > API keys
- Click on the “+” icon in front of Insert Keys
- Get the accountId and insert key on your screen
- Save these two values for making API calls through Anypoint Platform
Sending data from MuleSoft:
When we post a JSON body to New Relic, it automatically stores data into a tabular format. Then we need to perform NRQL queries to fetch data from the table and create various types of charts and visualizations. Every JSON should have a key value pair {“eventType”: “”}. All the data will be saved in a table name equal to the value of eventType attribute.
As an example, I created a Mule application with schedulers that is responsible for posting the below payloads to Insights:
{
    severity: "LOW",
    eventType: "InsightsLogs",
    env: "DEV",
    messageId: uuid() as String,
    muleAppName: "new-relic-insights",
    intgCreationDate: now() as String {format: "yyyy-MM-dd'T'HH:mm:ss.ss'Z'"},
    payload: write(payload,'application/json'),
    resultMessage: vars.errorMessage default ' ',
    result: "Success",
    endpoint: "/api/first"

}
And
{
    severity: "HIGH",
    eventType: "InsightsLogs",
    env: "DEV",
    messageId: uuid() as String,
    muleAppName: "new-relic-insights",
    intgCreationDate: now() as String {format: "yyyy-MM-dd'T'HH:mm:ss.ss'Z'"},
    payload: write(payload,'application/json'),
    resultMessage: "Unable to Post the message",
    result: "Error",
    endpoint: "/api/second"

}
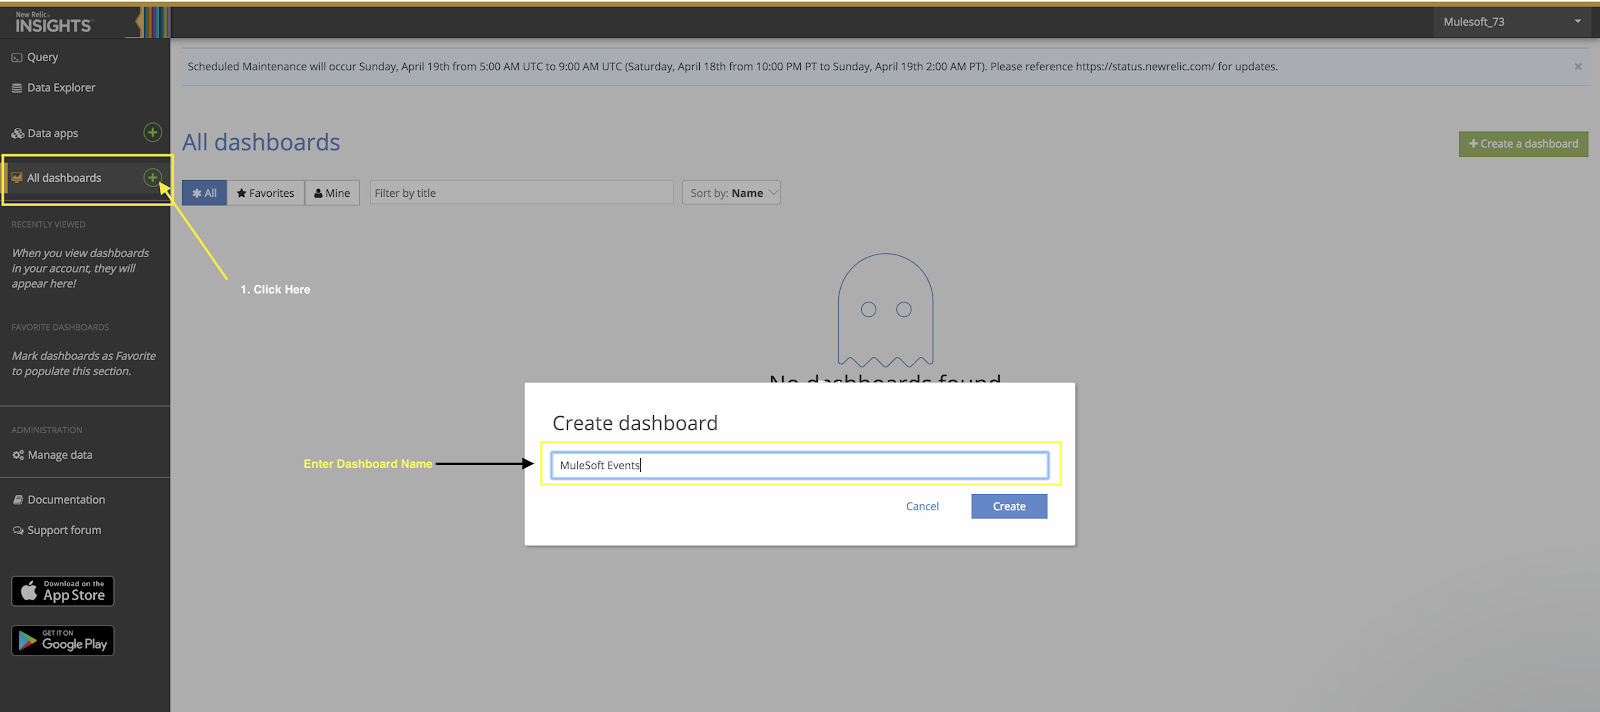
To create a dashboard in New Relic:
To add charts to the dashboard, run NRQL query and add the result to the dashboard: 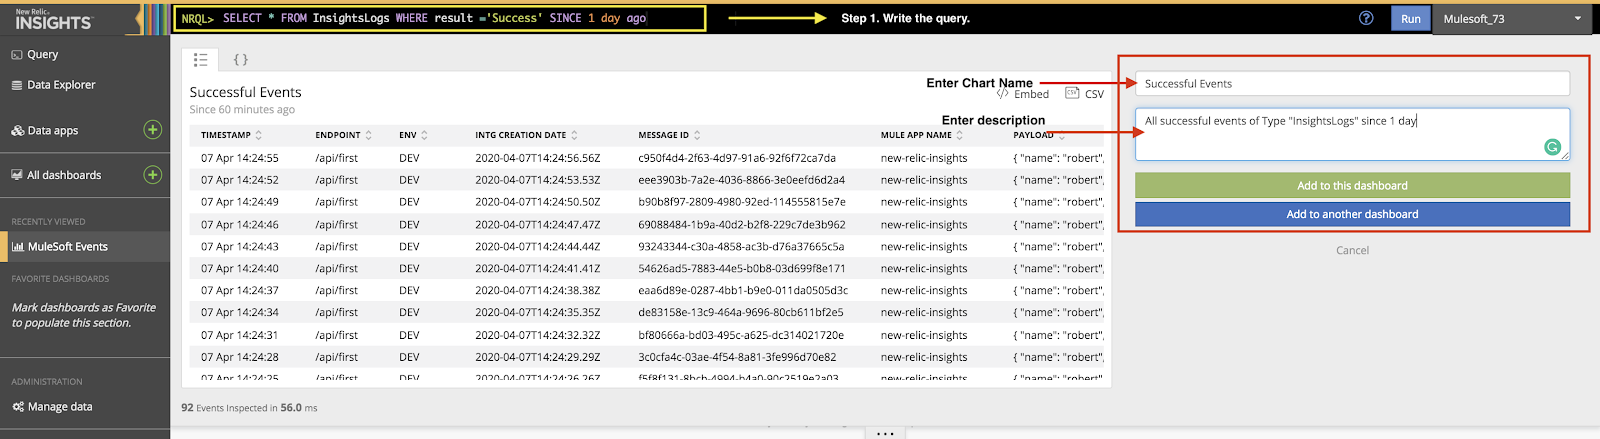
Similarly, you can create various charts and add to this dashboard.
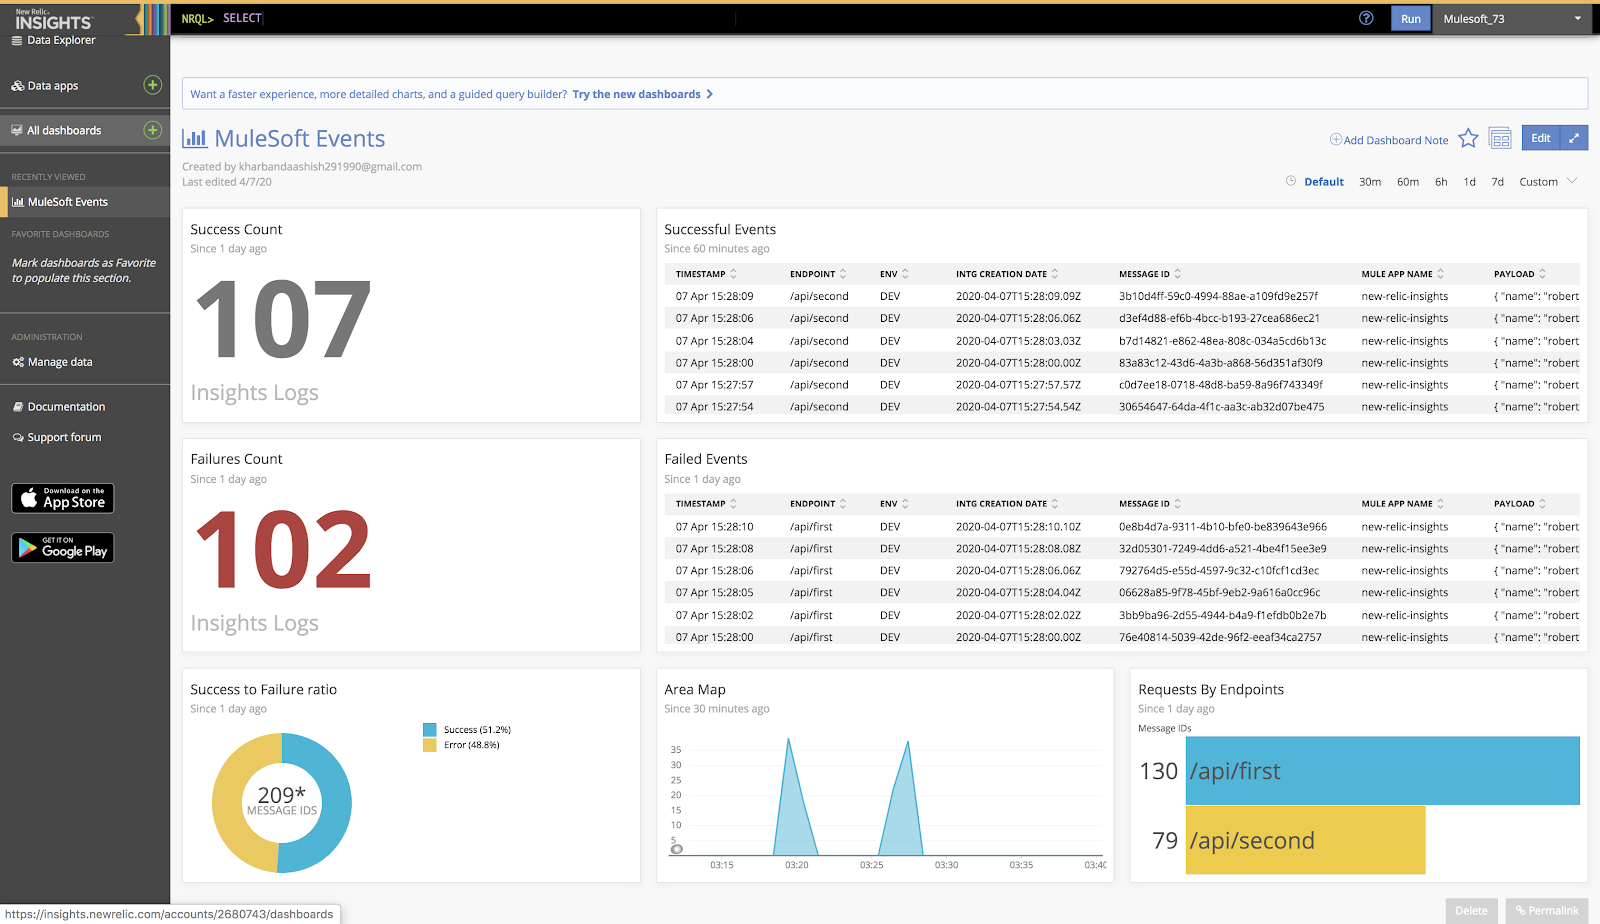
Below is a sample dashboard I created by using various charts:
Conclusion:
The above details show just how easy it is to build powerful dashboards and KPIs by sending various events to New Relic Insights. This solution can be expanded to other charts and multiple dashboards.
To try it out, begin your free trial of Anypoint Platform today.