
Logging is arguably one of the most neglected tasks on any given project. It’s not uncommon for teams to consider logging as a second-class citizen and it is usually taken for granted; until, of course, the team goes live and try to troubleshoot anything.
Once this happens, upper management might start doing some finger pointing:

This scenario, interestingly enough, has exacerbated in the last few years due to the rise of data aggregation platforms like Splunk, ELK, and others, and their ability to do full-text searches across any piece of “raw” data that developers manage to push into them.
Rather than encouraging better logging practices, this scenario gives developers the misconception that they don’t need to put any effort as long as they are able to aggregate their logs.
More often that I’d like to admit, the answer to the question: “How do you troubleshoot in production?” Is: “We just type error in the Splunk search box to find if something is wrong.”
What many teams don’t understand, however, is that text search is just a very basic and ad-hoc capability. These data aggregation frameworks only reach their full potential when they are able to understand, index, and exploit the data they are gathering. For this to happen, the data formats need to be somewhat normalized.
In my career, I’ve had the pleasure to work with very mature companies and brilliant architects who have the vision to understand the benefits of standardizing the way data gets logged across any business application.
A popular choice for most companies is obviously JSON, because its flexibility, efficiency, and human readability probably go unchallenged.
So “Let’s do everything in JSON!”
Now, hold your horses (or Mules?), because the decision to use JSON for logging is only the first step of getting the most out of your log data. The next important decision is: “What should I log?”
In a world where everything is becoming an API or microservice, chances are that any action performed on any application (e.g. placing an order) will span tens of different applications, systems, and devices. With data coming from such disparate sources, how do we ensure we get end-to-end visibility across every touch point?
To make things a bit more challenging, we architects typically put the burden of these decisions on our developers, without even empowering them with the necessary tools or frameworks to do so.
The result is that simple, core best practices – such as embedding correlation IDs on every log entry (for transaction correlation) – are not always followed, especially because they depend on the developer’s willingness to follow them. Failure to follow these best practices dramatically impacts the DevOps teams’ ability to troubleshoot down the road.
In this article, I’ll present an approach to logging in Mule applications and some best practices around defining the right data structure.
JSON logging in Mule
The out-of-the-box logger component offered by Mule runtime is really easy to use and understand, but it hardly enforces any standards and does not facilitate the creation of structured logs (nor does the underlying log4j, for that matter).

What if there was a way to keep the logging experience as simple as writing a one text entry, while having a full fledge JSON structure as the output?
What if we could automagically prepopulate logs with default values and dynamic expressions?
What if developers won’t need to worry about setting correlation IDs, tracepoints, calculate elapsed times, and every other single piece of data that can be derived from the environment or from MEL expressions?
Meet the JSON logger module
In order to fill this gap, I created a generic JSON Logger module (based on our DevKit SDK), which is considered a drop-in replacement of the existing Logger component. At the core of this implementation is the assumption that not every company will want the exact same data structure. Thus, the module was architected in a way that lets you customize the output JSON log by defining a matching JSON Schema.
Once you are satisfied with your JSON schema, all of the module’s code can be dynamically re-generated by building and packaging the module. The outcome will be a new JSON logger module that developers can install in Anypoint Studio and leverage from the palette like any other component.
How do I use the JSON logger module?
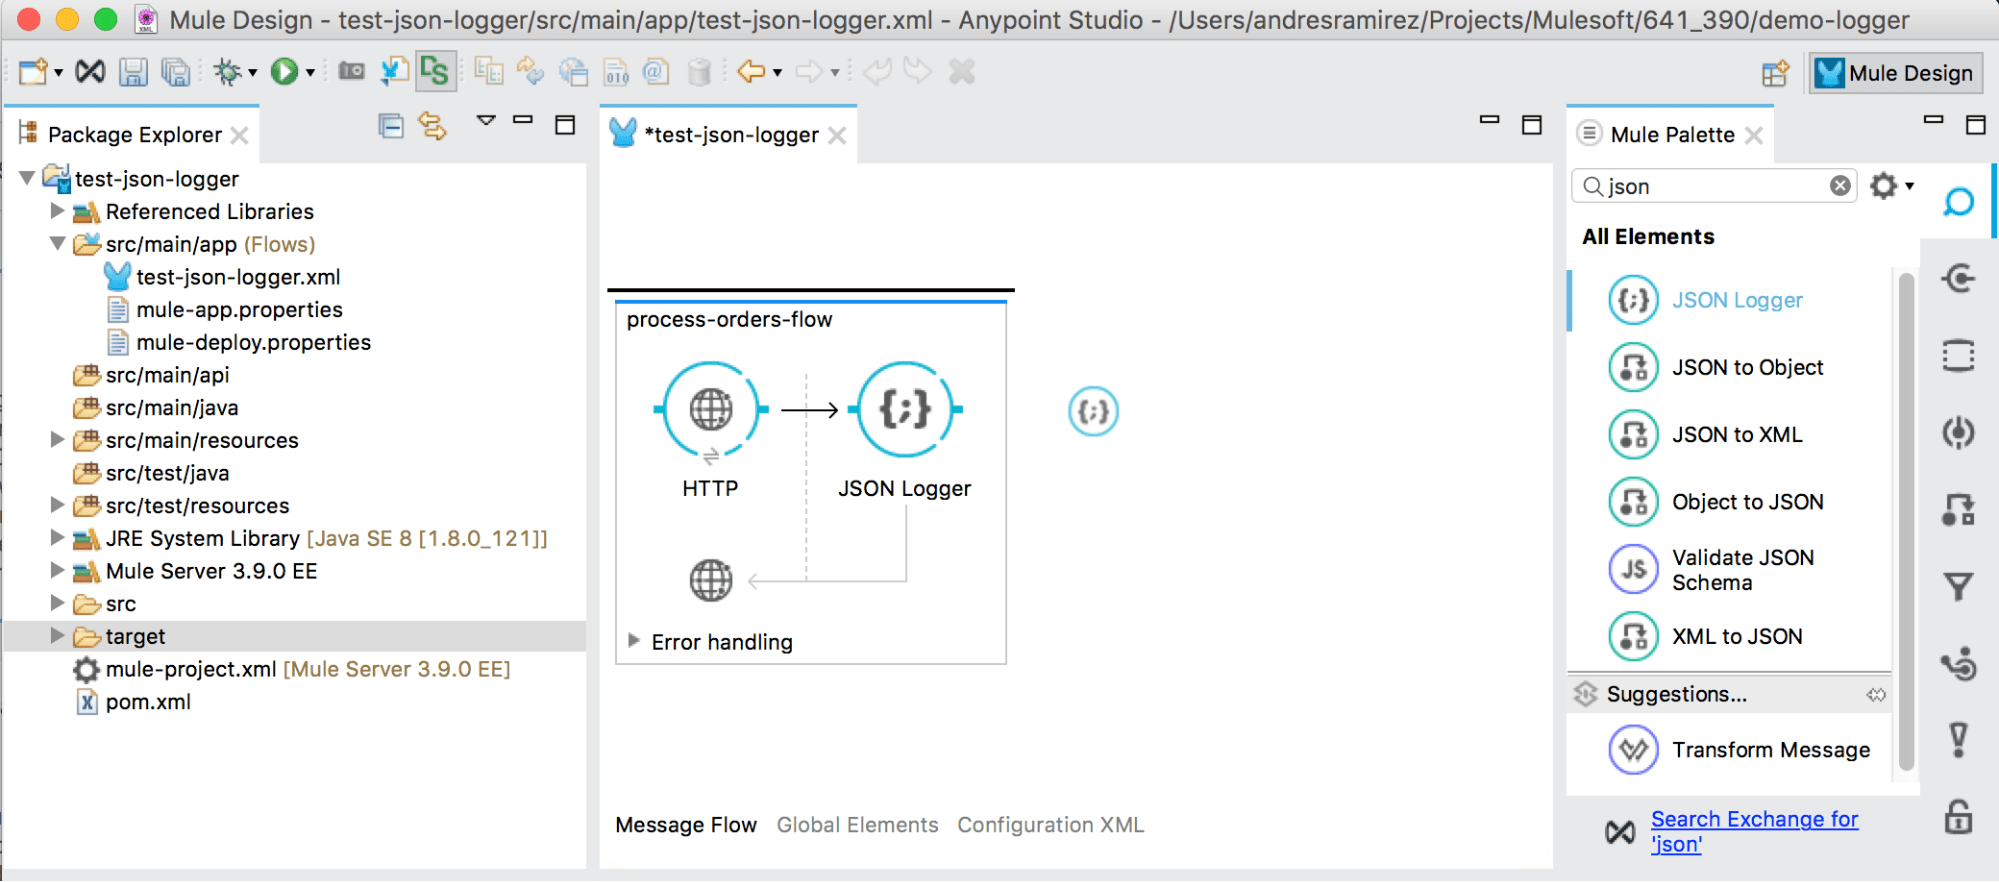
As you can see in the image above, once installed, the JSON logger will show in the Studio Palette as any standard component; it can also be dragged-and-dropped into the canvas.
From a usage perspective, the out-of-the-box implementation can be configured as follows:
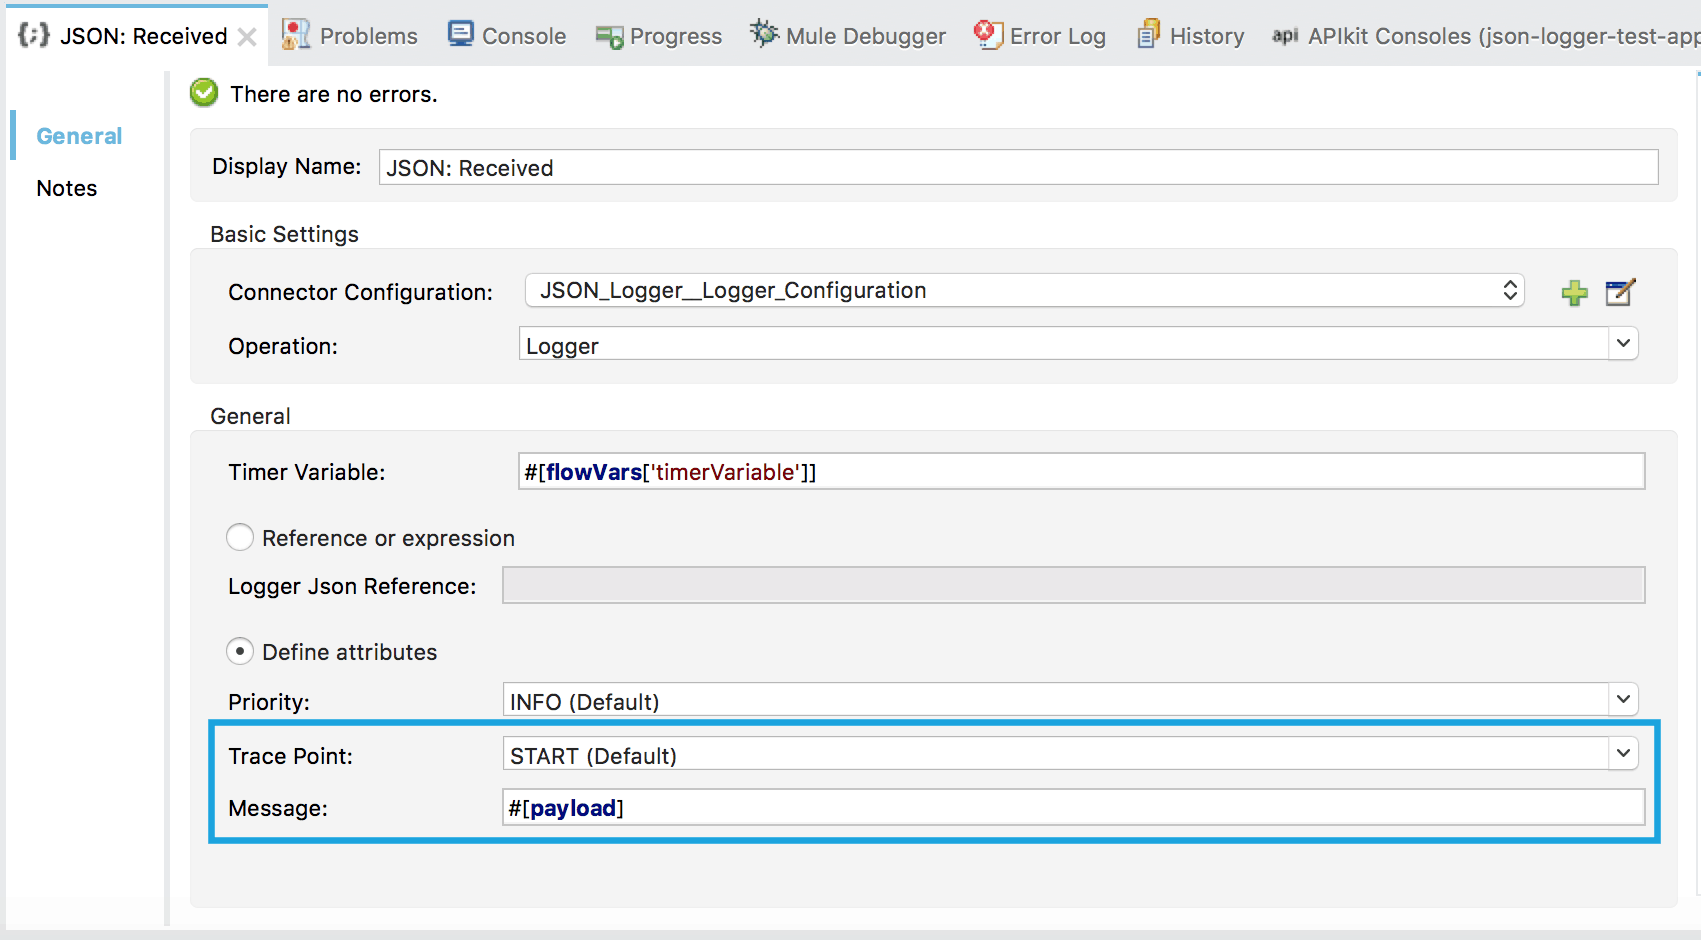
While it may look a bit more daunting than the base Logger component, the only part that a developer would define most of the time is the one highlighted in blue above.
In this scenario, we are logging the current #[payload]. We are also using the START Trace Point. Trace Points aims to facilitate the standardization of certain “check points” throughout the flow execution, which, in turn, enable more intelligent dashboards and reporting based on this data (e.g. to determine all the in-flight transactions we could query, what are all the transactions without an END trace point?).
The current JSON logger ships with the following Trace Points:
- START (Default)
- BEFORE_API_OR_BACKEND
- AFTER_API_OR_BACKEND
- BEFORE_TRANSFORM
- AFTER_TRANSFORM
- END
- EXCEPTION
Last, but not least, below is an example of what a flow may look like using JSON Logger:

And this would be the JSON logs that are generated:
{
  "applicationName" : "json-logger-test-app",
  "applicationVersion" : "1.0.0-SNAPSHOT",
  "environment" : "dev",
  "timestamp" : "2017-11-18 20:33:09.558",
  "rootCorrelationId" : "99825dc0-ccc9-11e7-87ad-f45c898c34ab",
  "correlationId" : "99825dc0-ccc9-11e7-87ad-f45c898c34ab",
  "threadName" : "[json-logger-test-app].api-httpListenerConfig.worker.03",
  "priority" : "INFO",
  "tracePoint" : "START"
}
{
  "applicationName" : "json-logger-test-app",
  "applicationVersion" : "1.0.0-SNAPSHOT",
  "environment" : "dev",
  "timestamp" : "2017-11-18 20:33:10.048",
  "rootCorrelationId" : "99825dc0-ccc9-11e7-87ad-f45c898c34ab",
  "correlationId" : "99825dc0-ccc9-11e7-87ad-f45c898c34ab",
  "threadName" : "[json-logger-test-app].api-httpListenerConfig.worker.03",
  "elapsed" : "556",
  "priority" : "INFO",
  "tracePoint" : "AFTER API OR BACKEND",
  "message" : "{"message":"mocked backend response"}"
}
{
  "applicationName" : "json-logger-test-app",
  "applicationVersion" : "1.0.0-SNAPSHOT",
  "environment" : "dev",
  "timestamp" : "2017-11-18 20:33:10.051",
  "rootCorrelationId" : "99825dc0-ccc9-11e7-87ad-f45c898c34ab",
  "correlationId" : "99825dc0-ccc9-11e7-87ad-f45c898c34ab",
  "threadName" : "[json-logger-test-app].api-httpListenerConfig.worker.03",
  "elapsed" : "558",
  "priority" : "INFO",
  "tracePoint" : "END",
  "message" : "{"message":"mocked data transformation"}"
}
As you can see, while the developer only had to worry about changing the trace point and what to log in the message (e.g. #[payload]) there is all this other data that gets generated for him or her.
How can I download the JSON logger module?
If you like what you see and want to try it for yourself, you can get the default version from our MuleSoft Services account for Anypoint Exchange and install it directly into Anypoint Studio.
To make things even easier, I provisioned a guest account that you can use to install the connector:
User: guest-mule
Pass: Mulesoft1
Just open Exchange from Anypoint Studio:
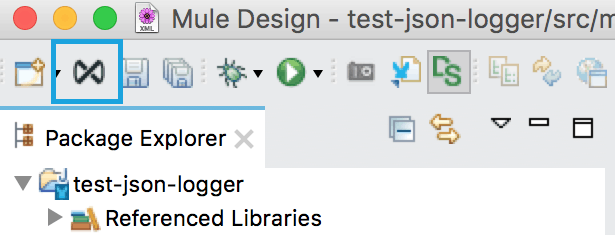
Log in with the guest credentials, select JSON Logger and click Install (top right):

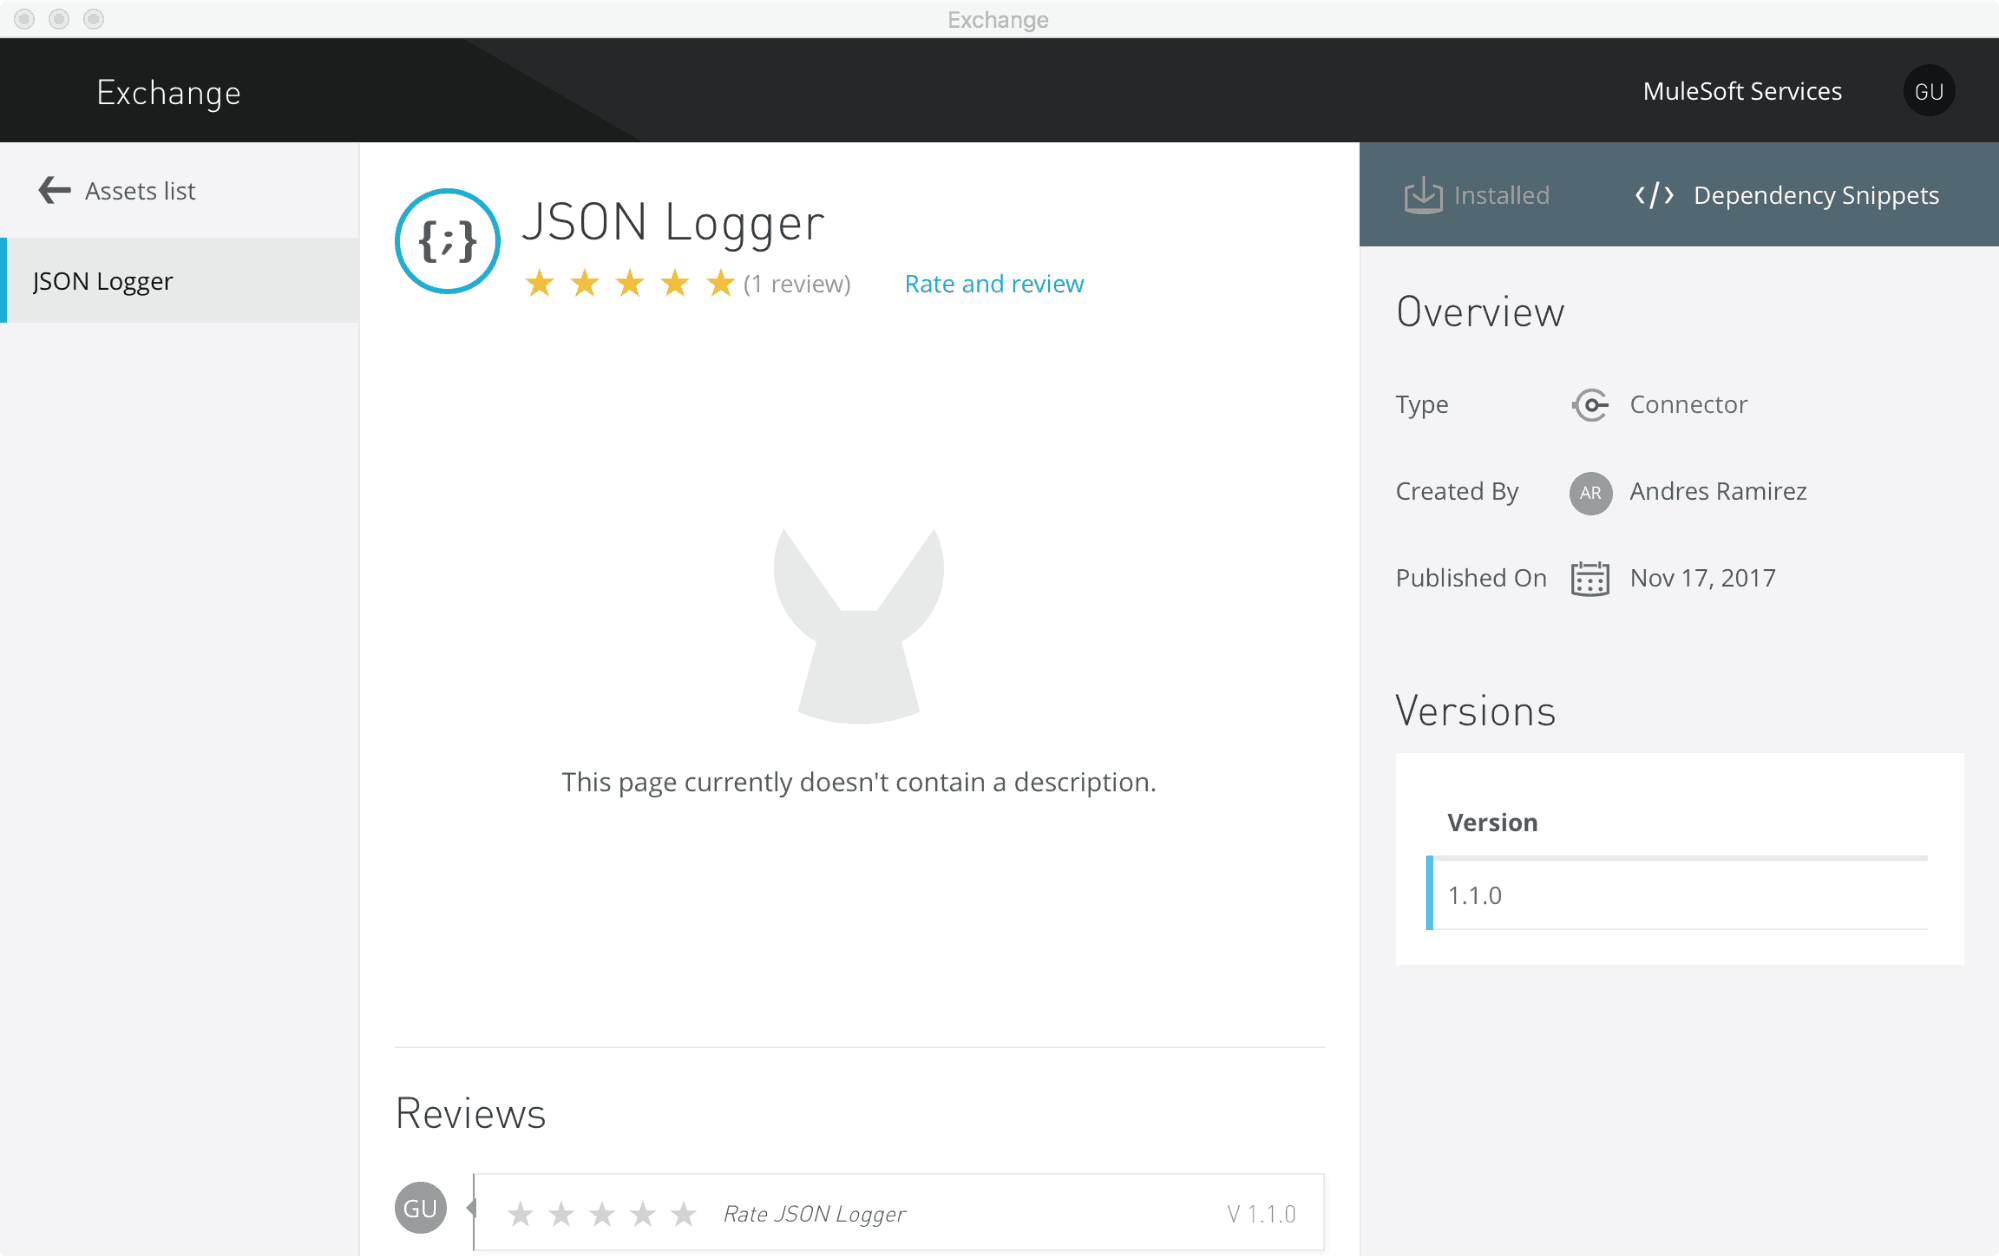
Then just follow the installation steps and voilà!
What is the default JSON structure?
If you are curious about what the current JSON schema covers out-of-the-box you can find it on GitHub.
How can I configure the JSON logger module?
It should be as straightforward as configuring any Anypoint Connector. You just need to define a Global Configuration and the fields are self-explanatory.
Starting with version 1.1.0, a new configuration option was introduced called: Logger with Anypoint MQ Configuration
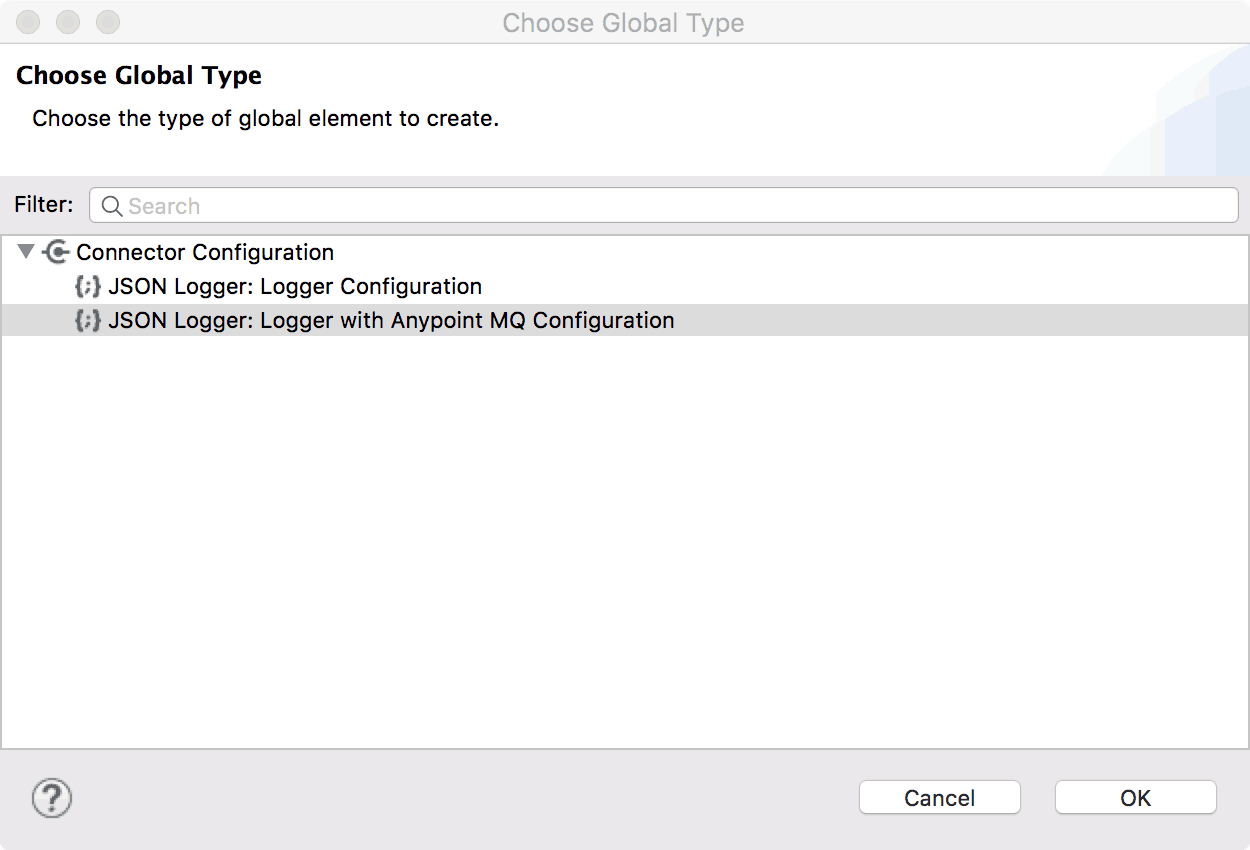

As the name implies, this configuration not only generates standard logs but it also forwards them to an Anypoint MQ destination (exchange or queue) asynchronously.
Why?
- Not every user has yet a data aggregator platform
- We don’t recommend pushing logs directly into a database
Thus, the logical option is to leverage our very own, flexible and scalable messaging solution to provide the perfect persistence layer for these messages. Users can then decide how to process them in any way they see fit (e.g. read them from a queue and push them into a database).
How can I further enforce best practices?
If you have followed this far, I hope this next part won’t disappoint you!
What better way to enforce best practices than using unit tests? What if we define as a developer practice – validated through code-review – that every main flow should have certain minimum tracepoints?
Let’s use the default json-logger-test-app as an example:

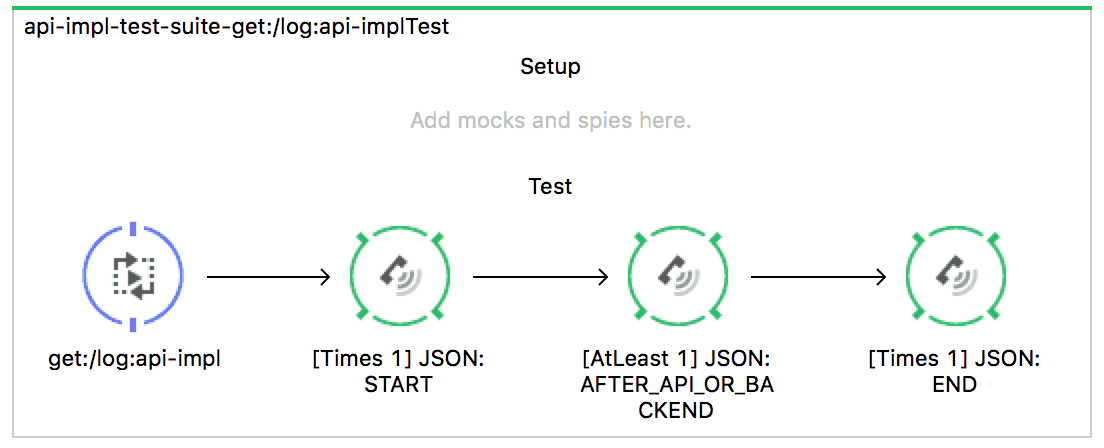
Now let’s add an MUnit test that verifies the following:
- START needs to be there only once
- AFTER_API_OR_BACKEND needs to be there at least once (we are connecting to something after all right?)
- END needs to be there only once
This very simple test would look like:
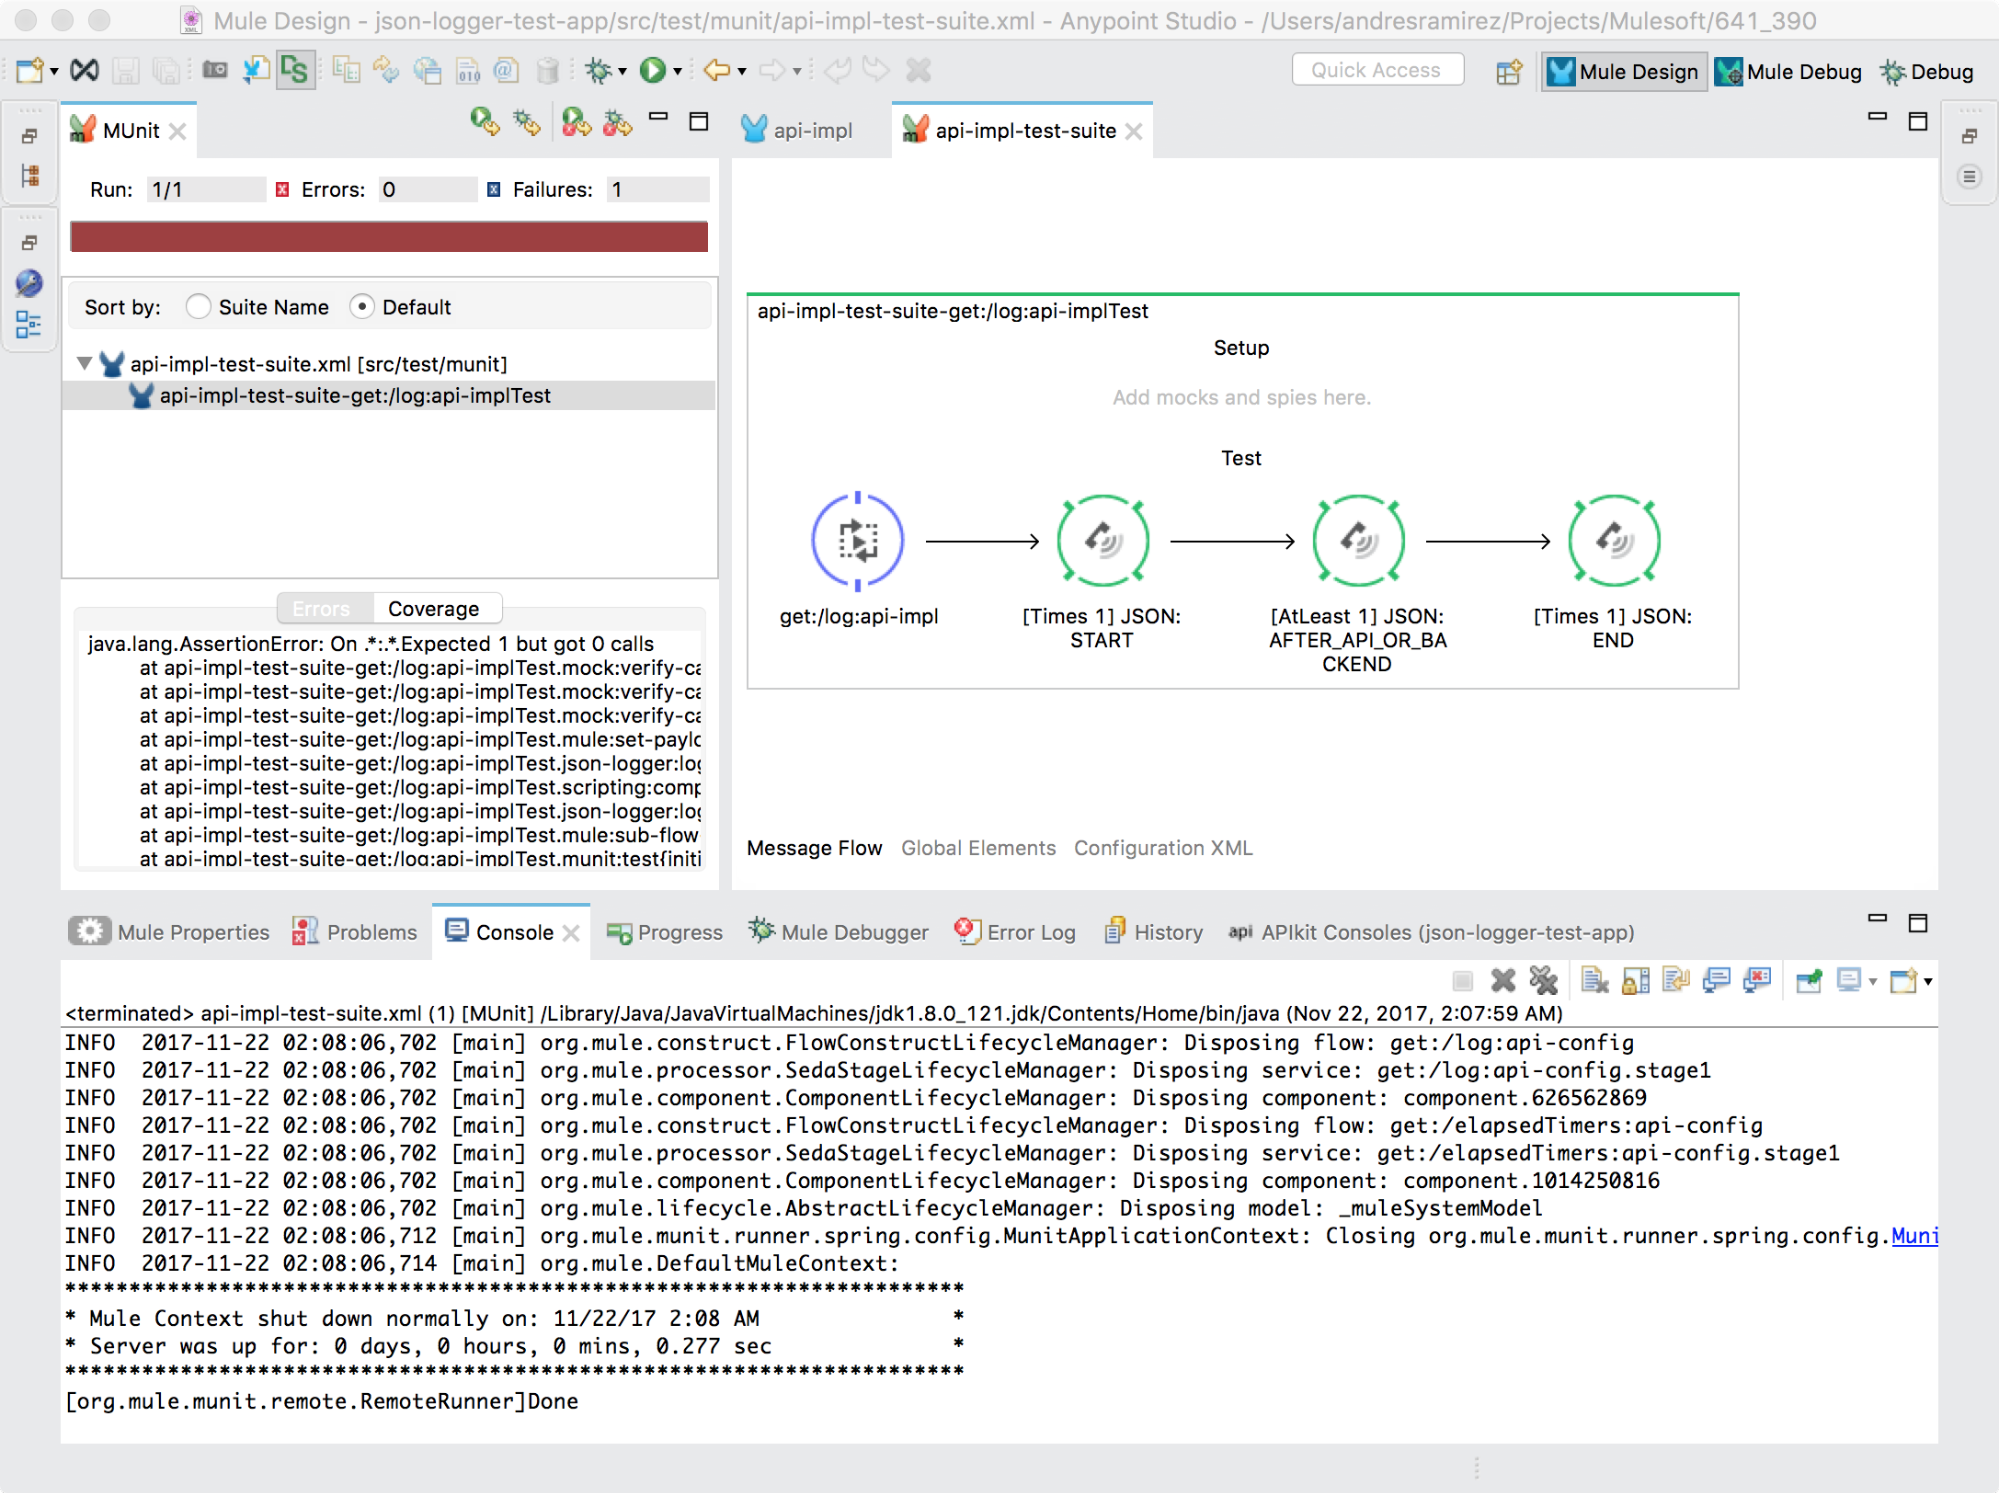
And of course, failing to comply with the test would result in this:
Conclusion
I’m confident some of these practices can help you start creating a better culture around DevOps (read more here) and ensure that you will always have the proper data when it is most needed.
Stay tuned for my next series of articles, on what this process looks like in practice when integrated with Splunk and how you can aggregate the logs into a cloud database using Anypoint MQ.
GitHub repository
Check out the GitHub repository for more information.


