
The pandemic forced governments, no matter the size, power, or wealth to react quickly to help their citizens. To better navigate the uncertainty of the future, how can government agencies make the right decisions to ensure the most vulnerable get the right help at the right time? To respond to this need, the public sector has leaned into data-driven analytics and data dashboards to equip the right people with the right information to keep people safe, healthy, and connected.
How data dashboards were used during the pandemic
Public sector agencies leverage analytics to preempt problems and improve constituent services. From predicting crime to combating national epidemics to improving emergency response preparedness, governments around the world are using data to inform decision-making. When the pandemic hit, more than 40 states created COVID-19 data dashboards to make decisions based on how and where the virus is spreading. Separately, the Centers for Medicare and Medicaid Services (CMS) has saved $1.5 billion by preventing Medicare fraud with its predictive analytics tool.
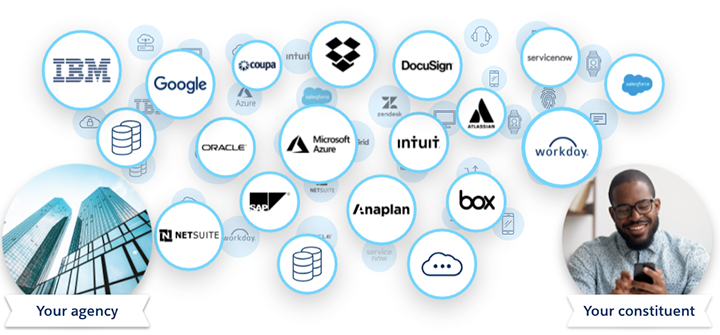
Despite the obvious benefits, there is an astonishing rate of failure in data-driven analytics projects. Gartner predicted an 85% failure rate in analytics projects. The core of the problem is access to data. Data today is siloed in various federal, state, and local systems. For example, determining eligibility for aid requires data from IRS, Social Security Administration, State DMV, and municipality systems. In fact, data silos continue to be a challenge year-over-year for 90% of organizations.
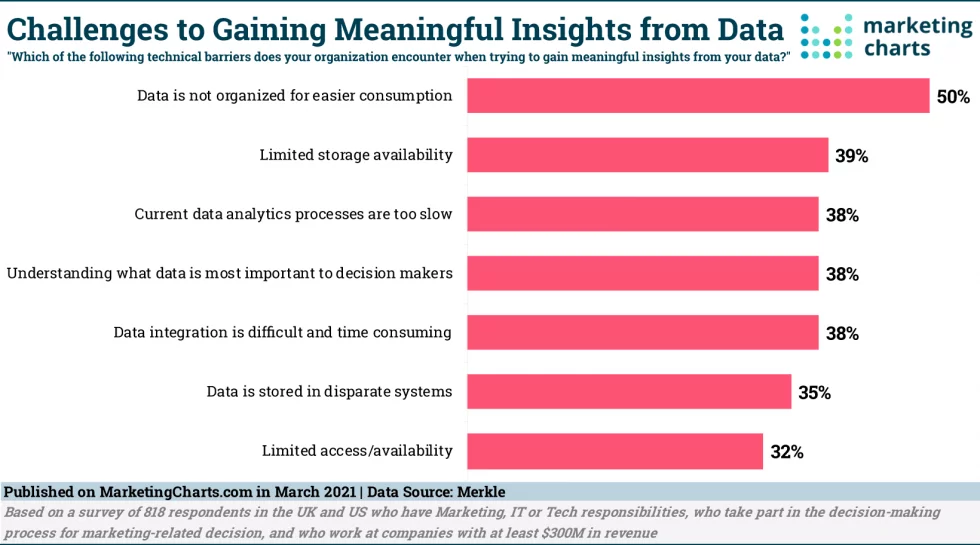
A recent survey published by Marketing Charts highlights access to data and integration as the top challenge faced by analysts and data scientists. Due to the siloed nature of data, more than 50% time of project time is spent discovering what data exists and where, gaining access to data, data provenance, and quality of data before even starting any analysis. All of this discovery and validation is manual, making it a very time-consuming process that’s prone to errors.
Three-step approach with MuleSoft and Tableau
Using MuleSoft’s API-led connectivity approach combined with the power of Tableau, government agencies can greatly simplify the delivery of data-driven analytics projects through a three-step approach:
- Discover and unlock data: MuleSoft Anypoint Exchange is a catalog for your analysts or data scientists to discover what data exists, evaluate the schema of data, and test drive sample data. MuleSoft provides hundreds of pre-built connectors, integration templates, and reusable APIs to unlock data silos to gain easy access to systems. MuleSoft also ensures your data is reliable, up-to-date, and aligns with your latest security, governance, and compliance standards.
- Analyze data: Empower everyone in your organization to see, understand, and analyze all your data in near real-time using Tableau intuitive capabilities. You can explore and analyze data by using visuals and natural language all powered by data from reusable APIs. MuleSoft Dataweave’s powerful transformation capabilities can be used for all data transformation needs. In addition to supporting traditional business insights and analytics use cases, the same APIs can be extended to AI/ML model training to support predictive analytics use cases.
- Act on data: It’s great to visualize data in dashboards and detect patterns and opportunities, but it’s no use if you can’t take action. MuleSoft and Tableau empower you to take action in the flow of analysis without switching apps and to automate the next best actions by reusing APIs.
Transforming data into actionable insights
The key to successful decision-making is through data-driven analytics. This approach continuously captures and analyzes data, then enables teams to take action as needed. MuleSoft empowers you to connect anything and Tableau enables you to visualize anything so you change everything.
To get inspired by a government office in the public sector industry, discover how the California Governor’s Office of Emergency Services is using MuleSoft’s FedRAMP-authorized Government Cloud to coordinate emergency preparedness, response, and recovery in real-time. You can also download our whitepaper on API-led data integration to learn more about the possibilities of combining forces between MuleSoft and Tableau.