This blog post was co-authored by Stephen Fishman, Regional Vice President – Customer Success Strategy & Architecture.
At MuleSoft we are enabling enterprises across industries in their digital business transformation journey. Our typical approach consists of understanding the current enterprise context, where they are in their transformation journey. In identifying what use cases and business value are being driven through MuleSoft, we can help enterprises:
- Build a strong API strategy grounded in business value
- Build a strong collaboration between both business and IT teams
- Create the beginnings of a data-driven culture
Consider the following example:
The enterprise is adopting API-based integration to increase revenue streams, and the C4E team is responsible to drive the initiative across the LOBs. A set of key KPIs that the C4E team is tracking is the number of lines of business utilizing Anypoint Platform to manage the APIs along with how many APIs are being used and reused. The C4E team plans to use these KPIs to:
- Gain detailed insights into which APIs are being used/reused the most.
- Identify which LOBs have the highest/lowest adoption rates.
- Identify which APIs have the least number of consumers and transactions.
In this blog, you will learn how to measure Anypoint Platform adoption and API reuse within an enterprise and apply some of the best practices to instrument these KPIs.
Operationalizing a practice of measurement
Some organizations may count the number of Anypoint business groups and the number of APIs in each. This can either be baselined manually (e.g., using tools like excel, which requires manual, expense laden, error-prone processes every month (refer to best practice #8) or you could level up and use a set of platform APIs via Postman or a custom application.
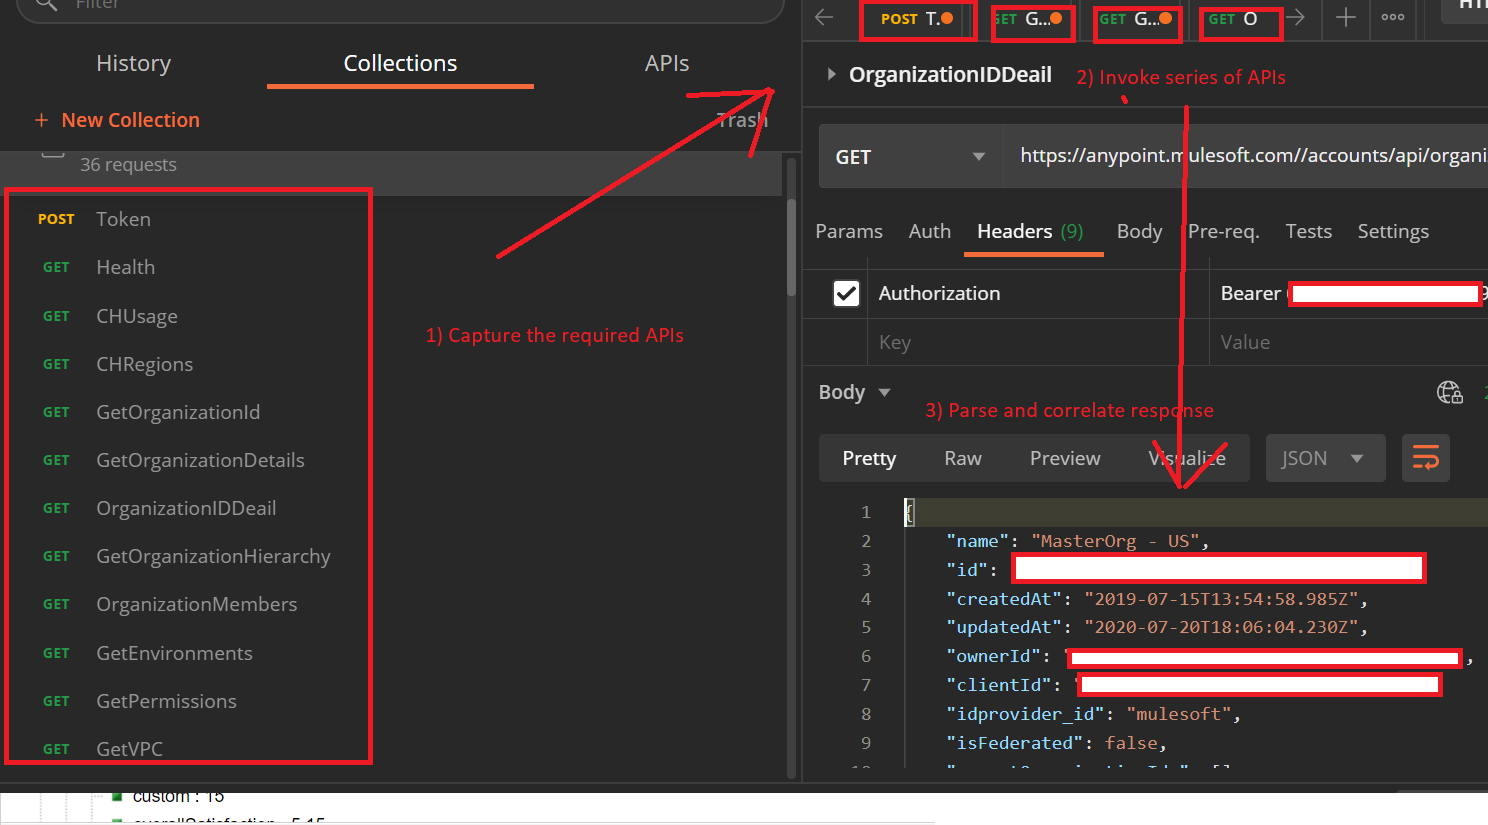
While the custom application may seem like the promise lane, this is still a time-consuming process — identifying the necessary platform APIs, parsing, and correlating the response from multiple APIs, not to mention piping the parsed results into a dashboard of some type.
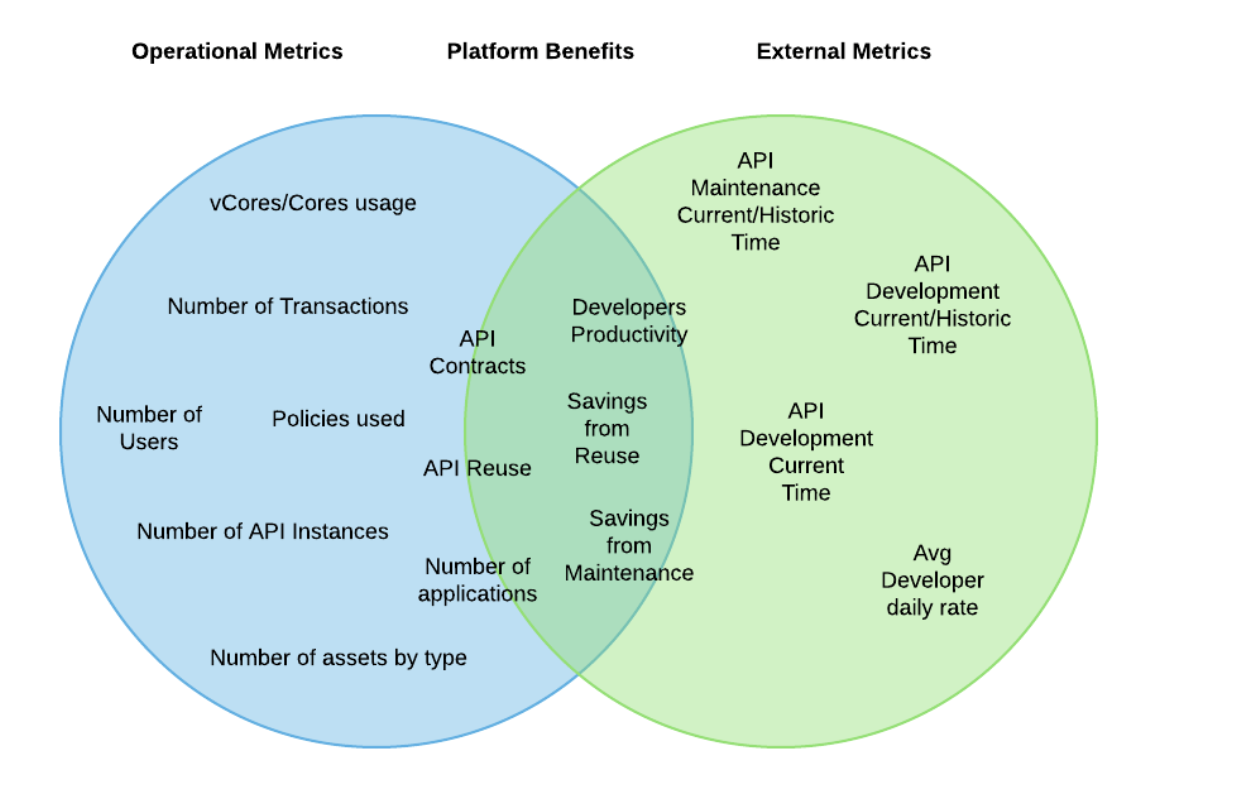
Instrumenting KPIs around API consumption
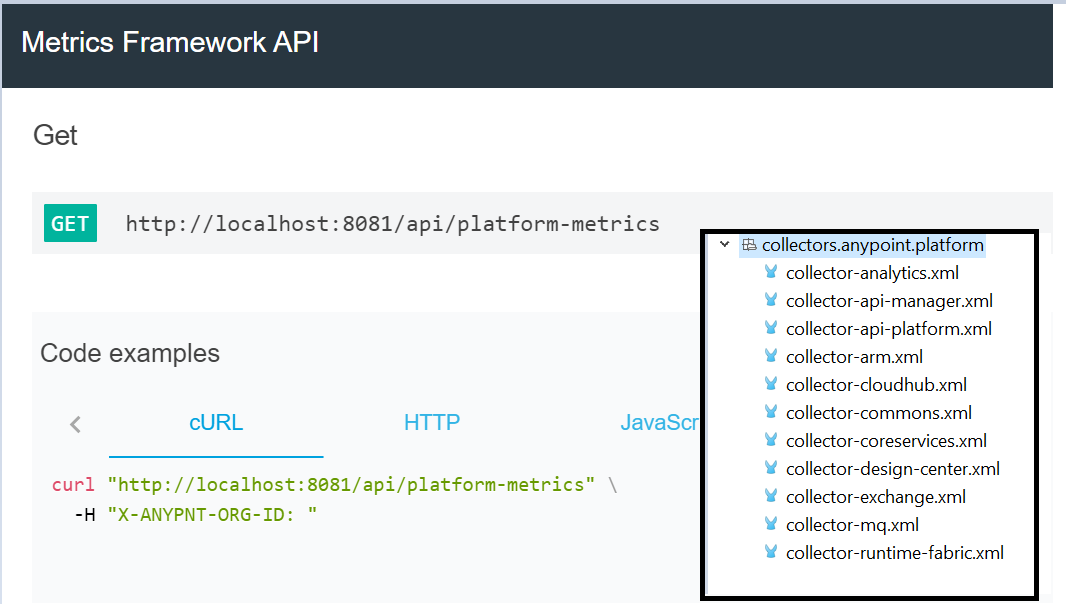
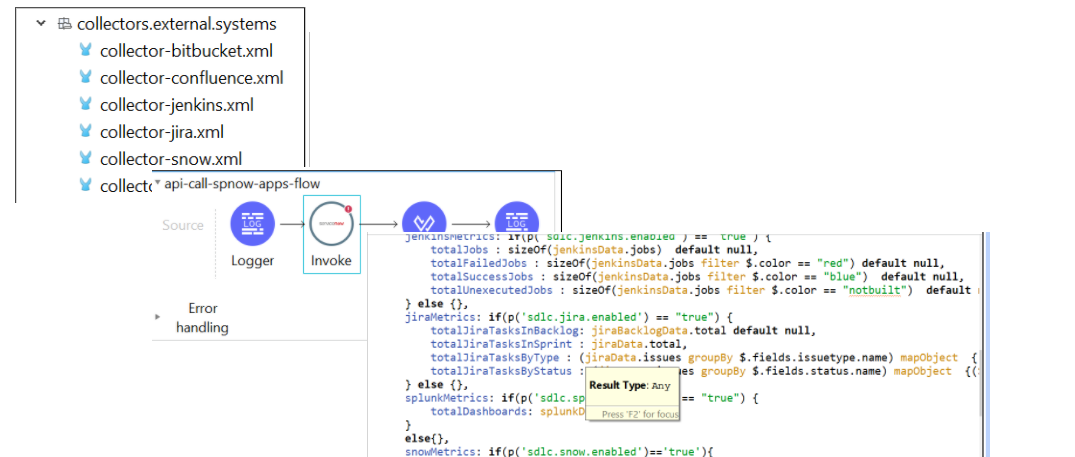
We’ve seen many customers struggle with pulling a set of repeatable metrics into a dashboard and as a result we’ve attempted to address the needs so many integration teams are facing. If you are starting or revisiting your integration KPI strategy, we recommend MuleSoft’s free, open-source Metrics-Accelerator. The Metrics-Accelerator smooths the path from “KPI definition to dashboard” by encapsulating all the complexities and providing a single API to compute over 120 platform metrics from Exchange, API Manager, Anypoint Runtime Manager, etc.
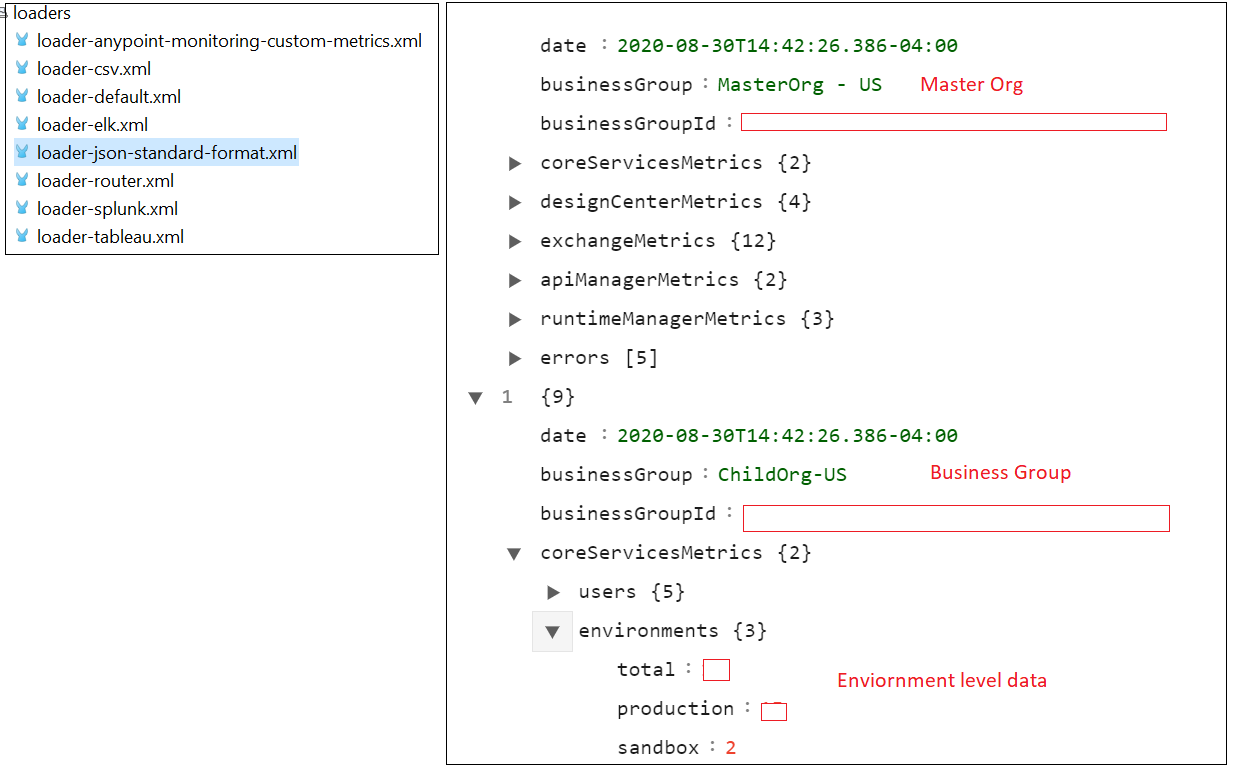
The flexible hierarchy format of the output makes it easy to measure the metrics both at an organization level or drill down into a specific business group:
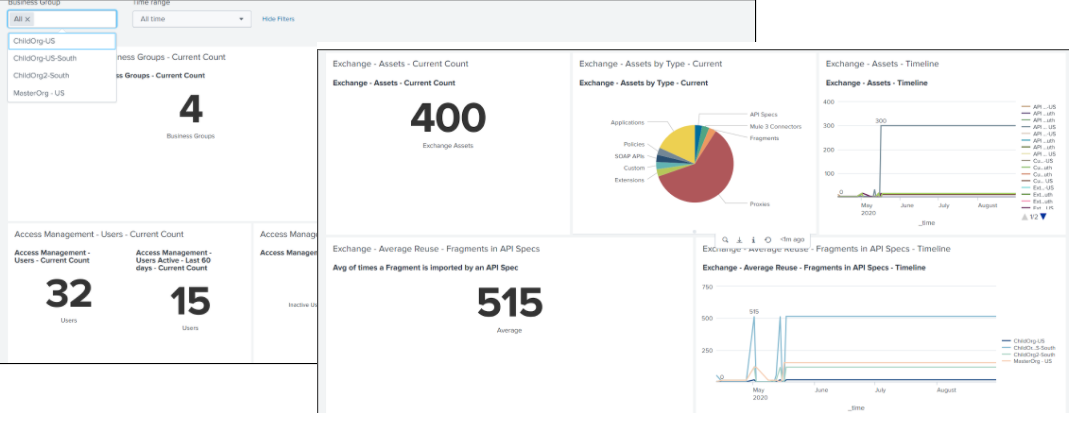
Our Metrics-Accelerator provides out-of-the-box connectivity along with pre-canned Splunk and Elk dashboards for visualization and provides an extensible integration framework to ingest data into a persistence store of your choice for your visualizations.
When evaluating a portfolio of KPIs and metrics, it is important to anchor on the core idea of establishing a KPI system to accelerate and improve the decision-making process. To achieve this outcome an enterprise must have enough metric/data points over a period of time to ground and inform good decisions (refer to best practice #1).
Going back to the earlier C4E team example, with the metrics accelerator, the C4E team will now have information on the number of business groups and API consumers, but they still won’t have sufficient insight into API adoption rates to make reasoned judgments and decisions on how to improve. Is it good? Is it slow? What factors impact the adoption rate?
These sorts of concepts and insights may seem difficult to incorporate given that the data behind any impacting factors (e.g., productivity, defect counts, incident counts, CSAT, etc.) aren’t stored anywhere in the MuleSoft platform. This is where the Metrics-Accelerator shines! By design, the framework was built to source out-of-platform ecosystem data from anywhere in your enterprise (e.g., SFDC service cloud, Service Now, VersionOne, Jira, etc.) and pipe it out to any visualization system of your choice. If it’s got an API, we can instrument that!
Using our C4E team example on adoption rates, let’s see how we can tailor and customize the framework to collect and aggregate contextual hedging metrics and factors that could impact the adoption rate, such as quality.
Revealing correlations with visualizations
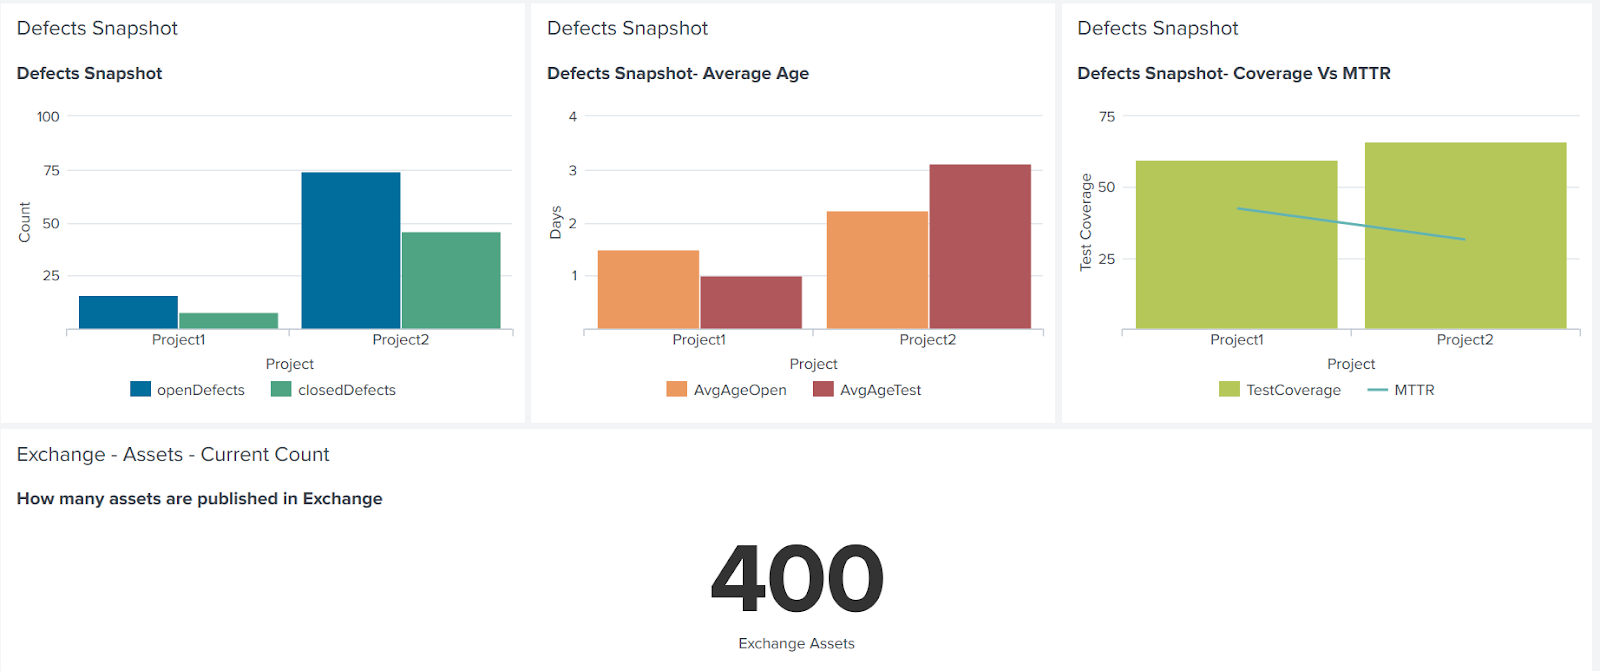
A true KPI system will capture data points from multiple systems — such as PPM tools, business transactional systems for end-to-end visibility, which opens up the ability to surface insights for improved and accelerated decision making (refer to best practice #1 and #3). To continue our example, let’s assume the C4E team decides to start with ingesting open and closed defect counts from ServiceNow to complement out-of-the-box platform metrics. Customizing the framework to capture the defect metrics from ServiceNow is as easy as creating a new flow with the ServiceNow connector and a set of transformations.
Now, when the C4E team visualizes the number of business groups and consumption rates along with the defect data, this helps to correlate environmental factors and ultimately and understand adoption rate dynamics better. For example, if the defect count is higher in one business unit than the other, the C4E team can see if this contributes to the slower adoption rate. This type of approach can create a “virtuous circle” of improved situational awareness across a development organization, as one good visualization begs insightful conversations and questions like “Is this purely the number of defects or is this aged number of defects? Do we care about the number of defects or the time it took to close them” (refer to best practice #6). With a more sophisticated lens, more sophisticated conversations will sprout up.
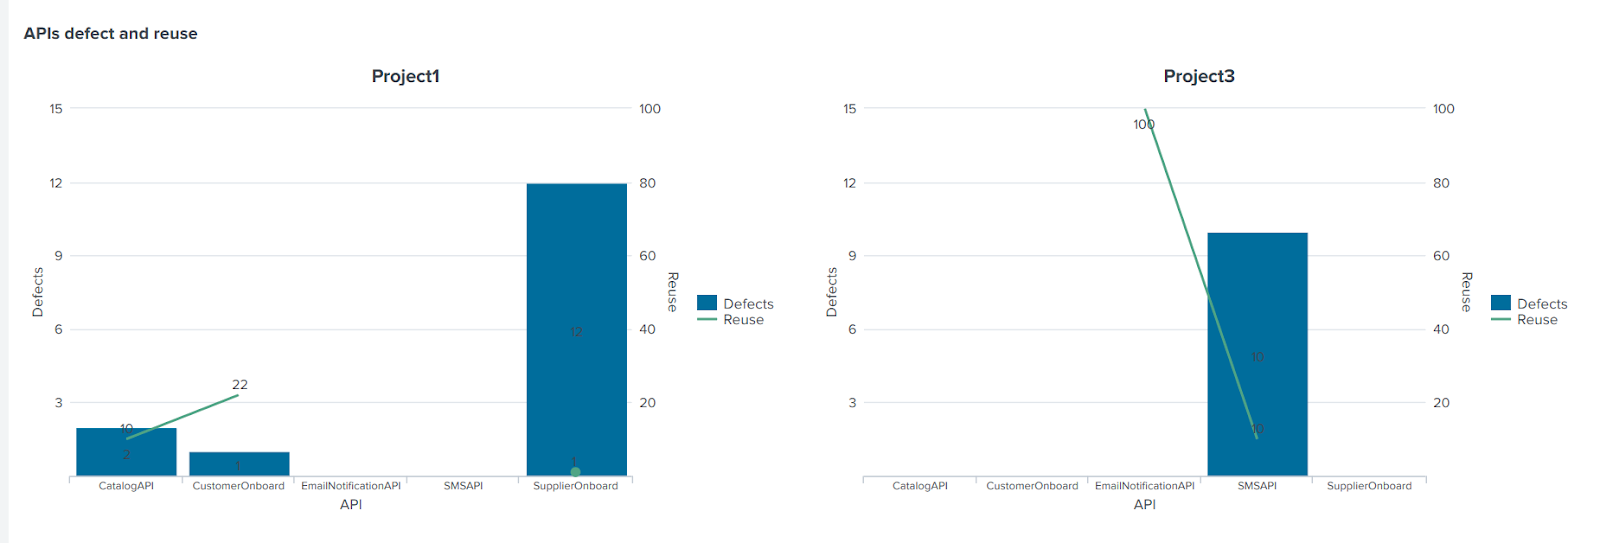
From the elevated conversation, the C4E team can then focus on specific areas for improvement and create targeted visualizations, for example correlating defects and reuse per API with the overall speed of delivery within a program, project or a business unit. To realize this, we now need to capture and persist API/component meta-data in the Project Management or Incident Management tools (e.g., Rally, JIRA ServiceNow, etc.), which can then be correlated with the defect count and reuse rates (number of consumers per API) drawn earlier.
For example, if your team is interested in improving the speed of releasing projects in production without sacrificing quality. This can be achieved by improving the quality of and testing infrastructure of the projects themself. Quality can be improved by working on the number of supporting parameters like the number of defects, code coverage, and time to resolve those defects. While many organizations have learned DevOps principles like how automated testing saves money (rather than costing money), not every organization has internalized the message and made the necessary shifts. Knowing that “data beats math,” bringing a multifaceted dashboard to the table can win over leaders and individual contributors alike.
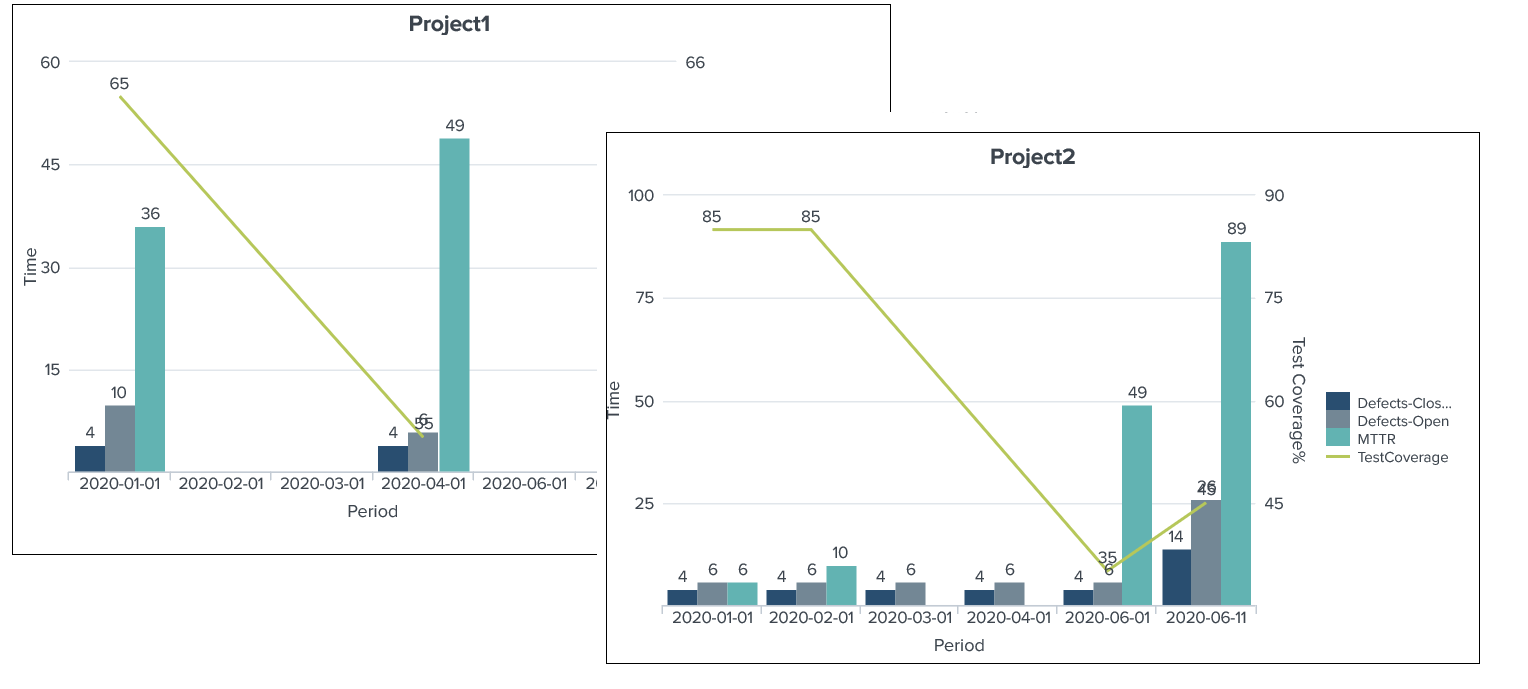
What we see in the sample dashboard above, is as the code coverage drops the defect count rises, which could impact the API consumption rate and is likely one of the defining factors behind the spike in “mean time to resolve” (the holy grail metric across operational disciplines). Gaining visibility into the quality data might not increase platform adoption/consumption directly but it does provide transparency to better decision making, which in this case could mean improving the process around code coverage and automated testing in general. Once we start to visualize, learn, and improve the data points across systems — such as platform and project management — we are in a much better position to observe, decide, and act (refer to best practice #11).
Timing is everything
Separate from the individual KPIs and metrics themselves, it’s important to understand and define a realistic frequency and retention period to capture these metrics. For example, quality-related metrics could be captured monthly and visualized as a bar chart for a period of two years. The metrics accelerator makes it easy to gain visibility in four main areas: people/teams, projects, processes, and technology. By having historical visibility in these areas, the involved stakeholders can make decisions grounded in data, anticipate technical and non-technical needs, and optimize time and resources.
Working with customers across the industry and geography what we’ve observed is that the lack of a comparative baseline makes it hard for integration teams to measure team progress against business objectives which then makes it almost impossible to justify practice and platform investment decisions.
There are numerous reasons for the lack of benchmarks:
- Siloed teams
- Ever-growing processes, tools, and systems
- Business pressure to clear the project backlog
- Lack of agreement on how KPIs should be defined
MuleSoft is committed to making the measurement process simpler, easier, and faster so that our customers can get the most value out of Anypoint Platform to drive business initiatives and digital transformation. We believe that having a pre-paved path to implement a data grounded and multifaceted KPI strategy can help our customers and we’re willing to go the extra mile so you don’t have to.
Our customers are utilizing the Metrics-Accelerator to improve process and delivery. For example, a large customer with federated LOBs customized the accelerator to capture metrics on governance. Tracking metrics like the number of APIs without security policies, exchange assets without proper taxonomy, and different business errors enabled their C4E team to run targeted enablement sessions to improve overall processes and delivery. We continue to gather feedback from customers on adoption and customizations — incorporating the customization in the source build for other customers to leverage in their ecosystem.
To accelerate your KPI management program, download our Metrics-
Accelerator and use the step-by-step video to get up and running today.