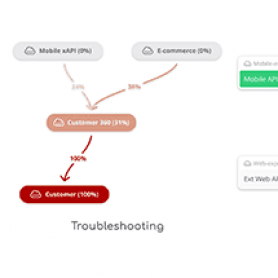
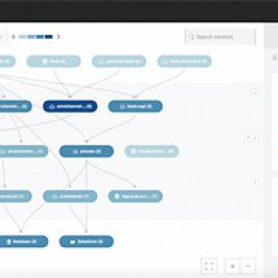
Introducing Use Case Specific Visualizations
This blog post explains a recent release of Anypoint Visualizer, which introduced a revamp to host multiple visualizations geared for specific use cases, including
Getting to know Anypoint Visualizer
Anypoint Visualizer is a graphical visualization that provides a high-level view of your application network. It automatically organizes APIs, Mule applications, and third-party systems
My internship at MuleSoft: Building groundwork for the future
It’s difficult to reflect on twelve weeks of rapidly changing work, completed for two different teams, and summarize it in a short blog post.


