The former Netflix Architect Allen Wang posted back in 2015 on SlideShare: “Netflix is a logging company that occasionally steams video.”
Five years ago, Netflix was creating about 400 billion events per day in different event types. Today, organizations can’t afford for their applications to have slow performance or experience downtime. To prevent that, engineers must rely on the data generated by their applications and infrastructure.
Centralized log management and analytics solutions, such as Elastic, have become more popular as a way to monitor applications and environments. Failures can be detected and solved proactively. In this post you’ll learn how to use Elastic with MuleSoft. We’ll cover the key components of the Elastic Stack: Logstash, Beats, Elasticsearch, Kibana as well as four different options to externalize MuleSoft logs to the Elastic Stack.
Elastic Stack overview
ELK stands for the three Elastic products Elasticsearch, Logstash, and Kibana.
To understand what the Elastic core products are we will use a simple architecture:
- The logs will be created by an application.
- Logstash aggregates the logs from different sources and processes it.
- Elasticsearch stores and indexes the data in order to search it.
- Kibana is the visualization tool that makes sense of the data.
What is Logstash?
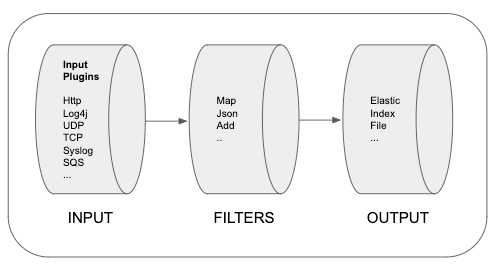
Logstash is a data collection tool. It consists of three elements: input, filters, and output.
What is Elasticsearch?
ES (Elasticsearch) is a NoSQL database that is based on the Lucene search engine. ES provides RESTful APIs to search and analyze the data. Different data types such as numbers, text, and geo — structured or unstructured — can be stored.
What is Kibana?
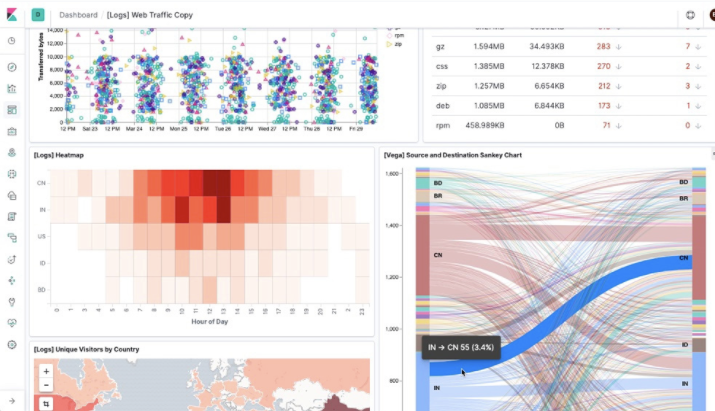
Kibana is a data visualization tool. It helps you to quickly get insight into the data and offers capabilities like diagrams, dashboards, etc. Kibana uses all the data stored on Elasticsearch.
Beats
Beats is a platform for lightweight shippers that send data from edge machines that can be used between the data source and Logstash or Elasticsearch.
Beats provides different “beats” to ingest different types of data. See descriptions for the different types of Beats here.
Read the official documentation on how to set up the Elastic Stack.
4 options to externalize CloudHub logs to Elastic Stack

Option #1: Log4j – Elastic

- Add the HTTP log4j appender to your Mule application (snipped below).
- Replace the URL and specify the index you want to use (e.g. mule-logs).
- You need to use _doc or _create in order to create the Index on Kibana.
- Add the Elastic Authorization Key.
- If you don’t want the token to expire then use ApiKey.
Note: The credentials are the base64 encoding of the API key ID and the API key joined by a colon.
<Appenders>
<Http name="ELK"
url="https://d597bb4cc8214ec999beff51c1d97879.eu-central-1.aws.cloud.es.io:9243/mule-logs/_doc">
<JsonLayout compact="true" eventEol="true" properties="true" />
<Property name="kbn-xsrf" value="true" />
<Property name="Content-Type" value="application/json" />
<Property name="Authorization" value="ApiKey replaceWithKey" />
<PatternLayout pattern="%r [%t] %p %c %x - %m%n" />
</Http>
</Appenders>
Option #2: Anypoint Platform APIs – Elastic

- Follow the tutorial of “Observability-of-MuleSoft-Cloudhub” developed by Elastic Engineering.
- Four Logstash pipelines will be used to retrieve and forward the logs.
- Anypoint Login
- Get Cloudhub Logs
- Get API Events
- Get Worker Stats
- The four pipelines will call the data over Anypoint Platform APIs and forward them to Elasticsearch.
- Example of retrieving the organizationId with Logstash:
# 2. Get organization.id
  http {
    url => "https://anypoint.mulesoft.com/accounts/api/me"
    verb => GET
    headers => {
      Authorization => "Bearer %{access_token}"
    }
  }
  mutate {
    add_field => {
      organization_id => "%{[body][user][organization][id]}"
    }
  }
Option #3: Log4J – AWS SQS – Elastic

- Clone the SQS-log4j appender.
- Build the SQS-log4j appender with Maven.
mvn clean install- Add the dependency to your Mule applications pom.xml file:
<dependency>
    <groupId>com.avioconsulting</groupId>
    <artifactId>log4j2-sqs-appender</artifactId>
    <version>1.0.0</version>
</dependency>- Add the SQS appender to the Mule log4j2.xml file and replace the values:
${sys:awsAccessKey}
${sys:awsSecretKey}
mule-elk (only if the queue name is different)
<Appenders>
<SQS name="SQS"
awsAccessKey="${sys:awsAccessKey}"
awsRegion="eu-central-1"
awsSecretKey="${sys:awsSecretKey}"
maxBatchOpenMs="10000"
maxBatchSize="5"
maxInflightOutboundBatches="5"
queueName="mule-elk">
<PatternLayout pattern="%-5p %d [%t] %c: ##MESSAGE## %m%n"/>
</SQS>
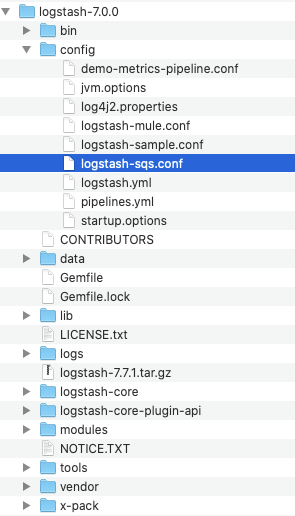
</Appenders>- Go to the folder where Logstash has been installed.
(e.g. cd ~/logstash-7.0.0)
Create a new config file in the config folder and call it: logstash-sqs.conf (you can also change the name)
- Insert the following code to your logstash-sqs.config file and input your SQS values:
eu-central-1 (only if your region is different)
mule-elk (only if your queue name is different)
enterYourSQSAccessKey
enterYourSQSSecretKey
input {
  sqs {
    region => "eu-central-1"
    queue => "mule-elk"
    access_key_id => "enterYourSQSAccessKey"
    secret_access_key => "enterYourSQSSecretKey"
  }
}

filter {
  json {
      # Parses the incoming JSON message into fields.
      source => "message"
    }
}

output {
  elasticsearch {
    hosts => "localhost:9200"
    codec => "json"
    index => "mule-sqs"
    #user => "elastic"
    #password => "changeme"
  }
}- Create an AWS account and search on the Management Console for “SQS.”
- Create a new queue on AWS. The queue-name will be used afterward.

- Make sure that the right permissions are given for the queue. You might need to create a new IAM user with the right role.

- Run Logstash:
Open your Terminal and change to the logstash directory e.g.:
cd ~/logstash-7.0.0


Run Logstash with the following command (make sure you tell logstash which .conf it should use. In our case it is logstash-sqs.conf):
./bin/logstash -f config/logstash-sqs.conf - Open Kibana on your local host and check the logs.
Option #4: Log4J – AWS SQS – Elastic

- Clone the JSON Logger Plugin Repository and follow the instructions. For additional information follow the tutorial by MuleSoft Professional Services.
- Create on Anypoint Platform an Anypoint MQ.
- Copy the Queue ID and URL.
- In Anypoint Platform, create a Client App ID and a Client Secret on the left side.
- Open the JSON Logger Config in Anypoint Studio and go to the tab “Destinations.”
- Replace the URL, enter the Queue ID, Client App ID, and Client Secret.
- Trigger your Mule application and check in Anypoint Platform to see if you receive the messages to the queue.
- Add the AnypointMQ connector from Exchange.

- Add an AnypointMQ Subscriber, a transform message, and a HTTP request to your Mule Application.

- Configure AnypointMQ Subscriber with the Queue URL, Client App ID, and the Client Secret. Add the Queue ID (mule-elastic-queue) to the configuration.

- Configure the HTTP Request call to the Elasticsearch REST API. In our case, we configure the call to our localhost with the Index “mule-logs.”
Important: Make sure you use the right port for the Elasticsearch instance.

- Add a transform message with the payload you want to send to Elasticsearch.
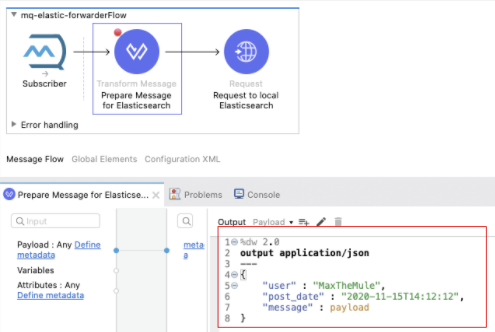
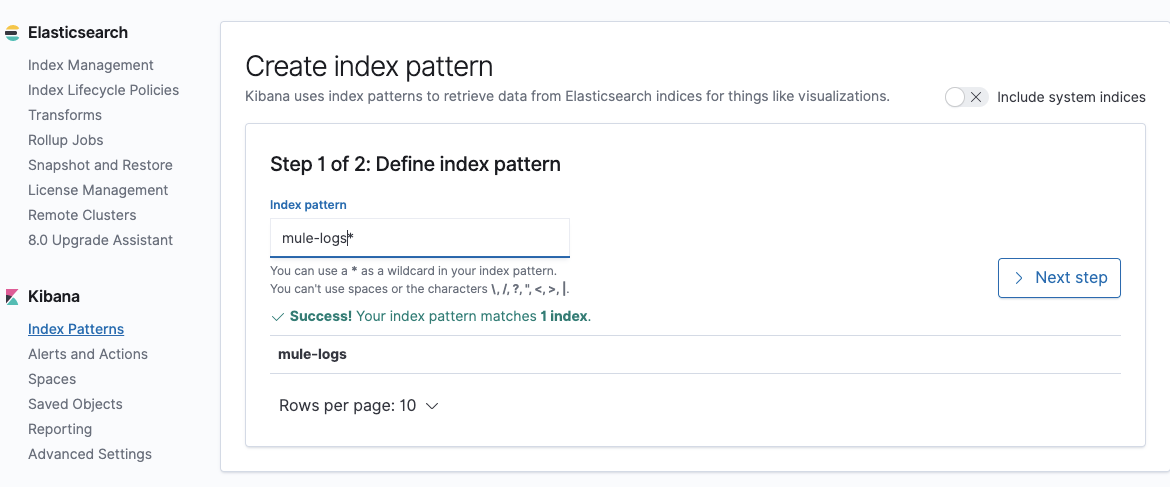
%dw 2.0output application/json---{ "user" : "MaxTheMule", "post_date" : "2020-11-15T14:12:12", "message" : payload}- Go to Kibana and select Index Patterns on the left menu. Create a new Index Pattern for mule-logs.*
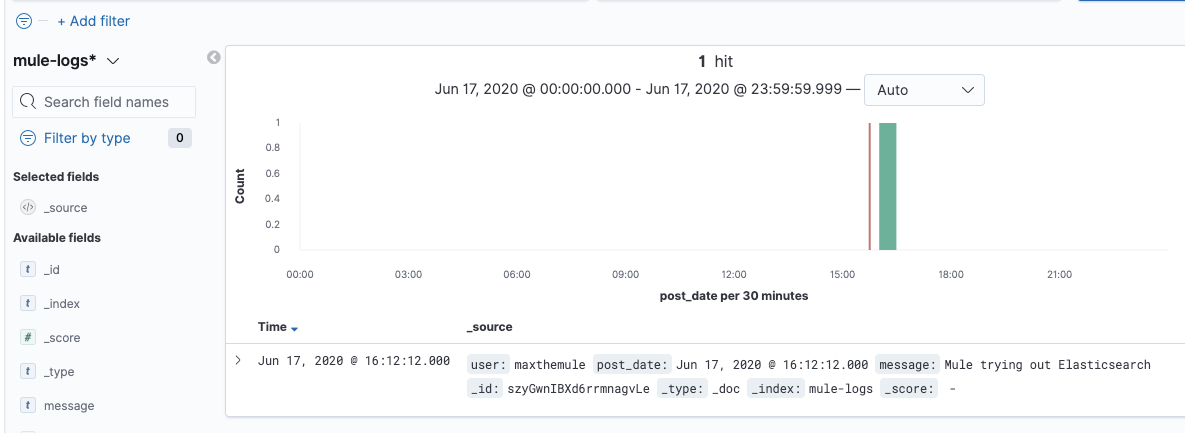
- As soon as you trigger the Mule App you will see all the logs on your local Kibana.
For more best practices on how to use Anypoint Platform, check out our developer tutorials.


