Today I will introduce our performance test of the Batch Module introduced on the Mule’s December 2013 release. I will guide you through the test scenario and explain all the data collected.
But first, if you don’t know what batch is, please read the great Batch Blog from our star developer Mariano Gonzalez, and for any other concerns you also have the documentation.
Excited? Great! Now we can start with the details, this performance test was run on a CloudHub’s Double worker, using the default threading profile of 16 threads. We will compare the on-premise vs cloud performance. Henceforth we will talk about HD vs CQS performance. Why? On-Premise and CloudHub users will be using by default the HardDisk for temporal storage and resilience but, this is not very useful on CloudHub as if for any reason the the worker is restarted, the current job will loose all its messages, then if Persistent Queues are enabled the Batch module will automatically store all the data with CQS (Cloud Queue Storage) to achieve the expected resilience.
The app used for the test have a constant processing time for each “step” and “commit” phase, allowing us to decouple, the time variations of using different services or record sizes. It was run modifying with two different parameters:
- Amount of records: How many records are loaded on the job, all of them with the exact same size.
- Record size: The normal distribution in bytes that is contained on the records sent to a job.
This will allow us to check the different performance variations when increasing any of this variables.
Now that everything is clear, lets start checking out the HD performance by its own, it was run with jobs of different Record sizes (on a logarithmic base) and 100.000 records each, which we assumed would be a standard load for a job:

The image speaks for itself, the performance is pretty flat, for most of the Record sizes, increasing with really big chunks of data, due to the increase of writing time on the HD.
But what are those different lines:
- Total time: Time taken since the message enter the job, till it finished.
- Loading time: Time taken since the message enters the job, till a message is process in the first step.
- (Total) Processing Time: Its the time taken since a message is processed in the first step, till the job finishes(all messages are processed on all the steps (if applicable)).
- Steps Processing Time: The time it takes to process all the records in each step, as all the messages are processed in all the steps at a constant time each, then processing all of them is constant to.
- Batch Processing Time: Its the Processing Time subtracting the Steps Processing Time, which let us with the batch overhead.
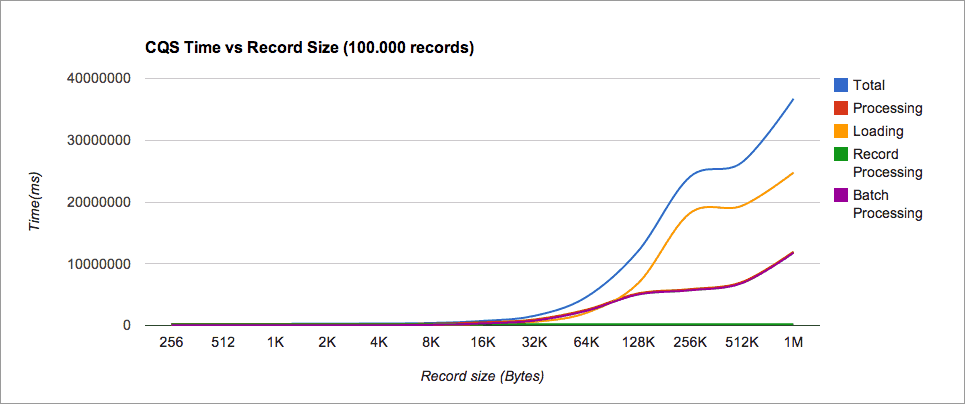
Ok, but what about CQS, lets do the same test:

Wow this doesn’t look so good right? This is why it is happening:
The records sent to the job are divided in blocks to reduce the amount of messages sent and received, this block will be send to a queue with a top capacity of 160K per message, when this capacity is exceeded, more messages will be used per block, if any record is bigger than 160K it will be store using a much more slower queue, causing a big loose of performance as seen above.
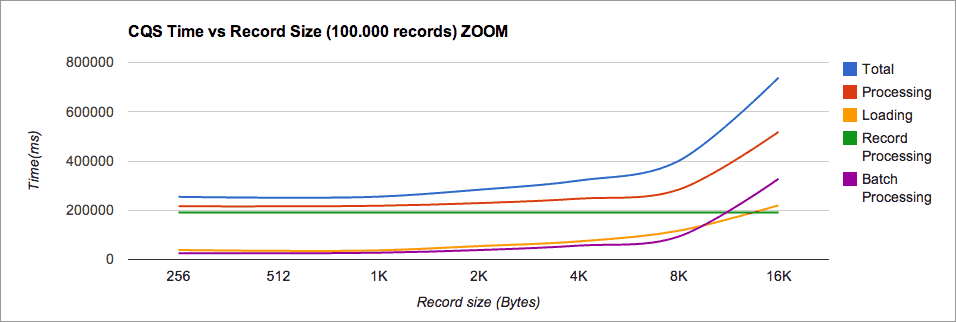
Lets zoom a bit and check the details:

It looks much better, it only adds an small overhead if you are having average payloads of less than 8KB. In the other hand it will start growing lineally with the input size (don’t get confused with the logarithmic scale!).
At this point we have seen what happens when we increase the record sizes, but what happens when we have more or less records? Lets check its behavior.
This test was run with different constant Records Sizes, increasing the amount of records. The HD case is just one, as it was seen before that it only changes with really big payloads.

As expected with bigger record sizes, there is a bigger gap between HD and CQS. Its very important to highlight that increasing the amount of records, increase the processing time lineally with different constants for each record size, which is something very important as it will take less time to process more data in one job, than dividing it on smaller chunks.
Lets zoom on the smaller record size cases:

Gratefully it show us that processing records of a size less or equal than 10K will add a pretty small overhead on the Cloud with the gratefully addition of resilience.
How we did it? With the help and passion of our awesome SaaS developers Mariano González at the ESB who pushed the idea from it beginnings and Fernando Federico who made it work quickly on CloudHub.
I hope this information gave you the proper knowledge about what to expect from your batch application, now go on and start batching the cloud!


