Skip the hampers and gift cards and give the developers on your team something useful this holiday season to transform their hard-earned skills into something creative.
Raspberry Pi
Way better than Fruitcake, Raspberry Pi is a credit-card-sized single-board computer running Linux that can be used for all kinds of great ideas from running a web server in your pocket to building home automation systems. We used one to fly helicopters using a fitness wristband device at our last MuleSoft hackathon. You can get one here for less than $50.
iOS Developer Program subscription
Mobile accounts for 13% of all Internet traffic. Next year there will be more mobile phones on the planet than people. By 2020, there is expected to be 50 billion devices in use. All developers should be keeping up to speed on how to develop for mobile platforms. Give your developer access to developing apps for iOS here for $99.
Sphero
Sphero is a robotic gaming system for iOS and Android. This little robotic ball, which is controlled by your smartphone, can be used for everything from playing games to augmented reality apps.
V-Moda Headphones
Developers wear headphones for a reason – writing code often requires deep concentration, which is helped by either blocking out noise or listening to music. These headphones allow them to be in their creative zone and focus better on their work. The V-Moda headphones are some of the best out there.
Become a Master Developer
All developers should know what it takes to be a great developer. To do so requires experience and mastering certain techniques, which you can learn about in the Pragmatic Programmer. You’ll learn skills, habits and attitudes that make a great software developer and form the foundation for long-term success in your programming career.
A Ticket to StrangeLoop
Developers love to learn and Strangeloop is one of the best conferences out there. As one of the top “developers’ conference,” it’s packed with code-heavy sessions ranging from new functional programming languages to big data to building large scale distributed systems.
Present like a Pro Being able to code is one thing. Being able to communicate your ideas both verbally and visually is also part of being a great developer. Presentation Zen: Simple Ideas on Presentation Design and Delivery is a great book on how to do presentations to groups in a fun, engaging and enjoyable way.
Bladepad for iPhone 5
Designed for gamers who like to play on the go, the Bladepad is a low-latency gaming controller that slides out from your iPhone when needed with illuminated joysticks and buttons.
21 Day Cleansing Program
All developers should know how to write great code. Robert Martin’s Clean Code describes the principles, patterns, and practices of writing great code including refactoring techniques, naming best practices, error handling and unit testing. Cleanse your code without starving it on juice drinks or extreme diets.
Fund Their Favorite Project
Fund your special developer’s favorite idea or project on KickStarter. There are thousands to projects to choose from and fund – ranging from consumer devices to games to movies. Who knows, it might even inspire them to go out and do their own startup some day.
Keep Fit
Developers spend a lot of time sitting at a desk on their laptop. Keep them motivated to stay fit with a Fitbit Force. It gives you real-time statistics on your wrist on steps taken, distance traveled and calories burned. It even tracks your sleep and can wake you up at your optimal time when you are in your lightest sleep phase.
Learn JavaScript
This one doesn’t cost anything. Give your developer friend some free time to learn JavaScript, which is the language of the Web and one of the fastest growing programming languages. Everything from new styles of web applications to high-performance server-side applications running on Google V8 is being fueled by JavaScript. Learning it is probably a really good thing to do. Here also is a great book to get started.
NAO Robot
These robots paid a visit at our recent company conference in Paris and were a big hit. Every developer’s dream, the NAO is a 2 foot tall programmable humanoid robot that moves with human-like precision. They have tactile sensors, gyroscope, accelerometer, infrared sensors, voice synthesizer, 2 HD camera, 4 microphones, Intel Atom chips, WIFI, Bluetooth and an API you can program to. And they can walk, talk and dance. If you’re feeling especially generous, you can buy one for around $16,000.
The Gift of Creativity
Developers love problem solving. If given a challenge, developers will stay up until sunrise to solve it, especially if it requires a particularly creative solution. There are a number of things out there that they can sink their teeth into from mobile to big data to cloud to smart machines. Give a developer a great technical challenge this holiday season and watch their creativity go wild.
We’ve all been there. Sooner or later, someone asks you to periodically synchronize information from one system into another. No shame to admit it, it happens in the best families. Such an integration should start with getting the objects that have been modified since the last sync (or all of them in the case of the very first sync). Sure, this first part sounds like the easiest of all the sync process (and in some cases it actually is), but it’s not without its complexity. Step by step you need to:
Go into a persistent store and grab the timestamp for the last update
If this is the first update, then you need to use a default value
Go into the source system and get all the objects that have been updated since that timestamp
Update the persistent store with the timestamp that should be used on the next sync. Notice that because the server time on your machine probably differs from the clock on the source system, you can’t simply use a value like “server.dateTime”. Instead, you need to select the greatest timestamp in the dataset you just got
Finally, you need to have logic not to update the timestamp if the sync failed
Not so simple after all isn’t it? Let’s take a look at a sample flow that does this in Mule:
This is how it would look like in XML: At Mulesoft we believe that this use case is generic enough to deserve a simpler solution. The flow above is way too complex and we haven’t even done the sync logic yet! So, we came out with the concept of Watermark.
Watermarking
The concept of Watermark refers to a flood after-match in which you look at the water stains in a wall to figure how high the water got, which is pretty much what we want to do in this use case: figure out which was the last item we updated and move from there on. What does watermark do for you?
It will automatically handle the ObjectStore, you don’t need to worry about that anymore
It will take care of checking if a watermark value already exists
It will help you get the next value
It will update the value when the flow is completed and will leave it untouched if it fails.
It will work with any type of List, Collection, Iterable or Iterator (including auto-paging ones)
So, let’s take a look at how the same flow looks using watermark: Way simpler isn’t it? What where’s the magic? Where did the behaviour go? The answer is the poll element. Let’s take a look:
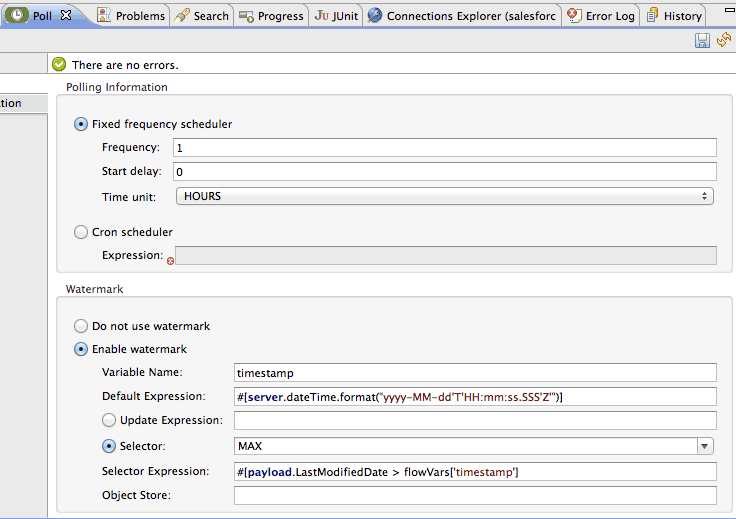
As you can see the poll element now has a watermark element that implements the same behaviour we saw in the first example but in a declarative way:
First we provided the name of the flowVar that will hold the value
Then we provide the default value expression, in case the component cannot find a value for the watermark. This is the first big gain: we don’t have to worry about the ObjectStore’s state
Then we choose a selector, which is the criteria we want to use to pick the next value. There’re four available selectors: MIN, MAX, FIRST and LAST. In our case, we want the greatest LastModifiedDate so we’ll choose MAX
Finally, we entered a selector expression. This expression works in tandem with the selector by being executed on each object the salesforce query returned. The selector collects the return values and selects the right value
Optionally you can specify which object store you want to use but you don’t have to. Mule will select the user object store automatically.
If the flow ends without errors, watermark will automatically update the object store with the new value. Yeah! Go away complexity! Look how much more compact the XML looks like:
Advanced use cases
In our experience, the four available selectors pretty much fit most of the use cases. If your use case requires custom logic to determine the new value, you can also provide your own update expression which will be evaluated once at the end of the flow.
Summary
Watermark is a tool to simplify querying for updated objects, which is a very common use case when synchronizing data. This feature is available in the latest Studio. What do you think of it? Thanks for reading!
We are all very proud to announce that Mule’s December 2013 release shipped with a major leap forward feature that will massively change and simplify Mule’s user experience for both SaaS and On-Premise users. Yes, we are talking about the new Batch jobs. If you need to handle massive amounts of data, or you’re longing for record based reporting and error handling, or even if you are all about resilience and reliability with parallel processing, then this post is for you!
Why Batch? In depth Context & History
If you’ve been following my posts then you know that when I first joined Mulesoft my job was related to architecting SaaS integration apps deployed on CloudHub. The first time that the need for a module like this crossed my mind was on an application that needed to move files from one SaaS system to another. It was expected that each execution of my migration flow would move around 8GB of information distributed in up to 30K files. If this app was to have bullet proof quality at the very least I needed to make sure that:
If one file fails to be transferred we can continue with the rest.
I get to retry any failed files.
Since this was a long running/network intensive process, I need to assure that if for any reason my app or any of the other endpoints crashed, I get to resume form the point I originally was on.
I need to have a UI to keep track
I managed to successfully achieve all of the above quality points, but I became aware that although it was still easier to do it with Mule than with custom code, there were several functionality gaps that nor the ESB or CloudHub were offering.
Only a few weeks later, a second project came with the following requirements:
Poll each system every 5 minutes. Expects an average of 5K updated objects on each poll, on each endpoint
Detect and filter cycles and duplicates
Synchronise accounts first. Skip any contacts which account hasn’t been synchronised yet.
And most important: All of the quality attributes of the app above
It was clear by now that I had found a common use case that responded to the same design pattern:
Get data
Split
Queue in persistent store so that memory is not an issue with large datasets
Process record by record
Track progress
Report
Although this app was considerably more complex than the prior one, we successfully delivered it but development was way more painful, including a not so natural integration between Mule and Spring Batch. At this point it was absolutely clear to me that we needed a new construct in Mule to address these use cases. SaaS use cases are fundamentally different from the on-premise ones and part of my job was closing the gap, so I went to our awesome support team and learned that this was a huge need for on-premise users too, who were struggling with Spring Batch and ETL tools. It was turning out to be so common that actually a third application with these kind of requirements surfaced while writing the spec for the batch module.
So, What’s Batch?
Batch is a new Mule construct that provides the ability to process messages in batches. Within an application, you can initiate a batch job which is a block of code that splits messages into individual records, performs actions upon each record, then reports on the results and potentially pushes the processed output to other systems or queues. This functionality is particularly useful when working with streaming input or when engineering “near real-time” data integration between SaaS applications.
For example, batch processing is particularly useful when working with the following scenarios:
Integrating data sets, small or large, streaming or not, to parallel process records
Synchronising data sets between business applications, such as syncing contacts between Netsuite and Salesforce, effecting “near real-time”data integration
Extracting, transforming and loading (ETL) information into a target system, such as uploading data from a flat file (CSV) to Hadoop
Handling large quantities of incoming data from an API into a legacy system
Working side by side with DataMapper, DataSense and the Anypoint Connectors, Batch turns the Mule platform into a powerful data handling tool combining all the power of Mule with ETL.
The batch feature is huge and will only keep growing in future mule releases. It’s way too big to make it fit into one single post so let’s take a quick dive into its main features and we’ll elaborate on more specific use cases in future posts.
Batch Anatomy
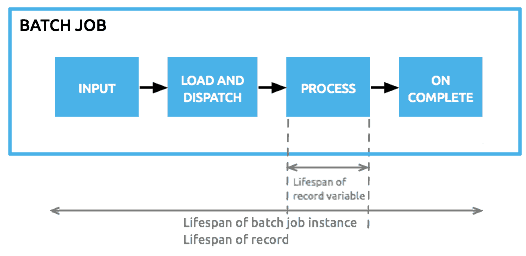
A batch job is a top-level element in Mule which exists outside all Mule flows. Batch jobs split large messages into records which Mule processes asynchronously in a batch job; just as flows process messages, batch jobs process records. A batch job contains one or more batch steps which, in turn, contain any number of message processors that act upon records as they move through the batch job. A batch job executes when triggered by either a batch executor in a Mule flow or a message source in a batch-accepting input; when triggered, Mule creates a new batch job instance. When all records have passed through all batch steps, the batch job instance ends and the batch job result can be summarized in a report to indicate which records succeeded and which failed during processing.
A job instance execution moves into phases:
Input phase: This is an optional phase in which you can place a one-way message source and/or message processors to prepare the data that is actually going to be fed into the job. At this point you’re processing synchronously at a message level
Loading phase: This phase is automatic and implicit. You don’t have to do anything here. This is mule automatically taking the payload that came out of the input phase, splitting it into records and storing it in persistent queues.
Process phase: In this phase, each records is processed separately and moved across the steps in an asynchronous and paralleled fashion.
On Complete phase: In this phase you get a result object that tells you how many records were processed, how many succeeded, which ones failed (and in which step), etc. This is useful for generating reports and sending out notifications
Step by Step
In the third phase, Process, Mule begins asynchronous processing of the records in the batch. Within this required phase, each record moves through the message processors in the first batch step, then queues up for processing through the next batch step and so on until every record has passed through every batch step. Note, however, that a batch job instance does not wait for all its queued records to finish processing in one batch step before pushing any of them to the next batch step. Queues are persistent.
Mule persists a list of all records as they succeed or fail to process through each batch step. If a record should fail to be processed by a message processor in a batch step, Mule can simply continue processing the batch, skipping over the failed record in each subsequent batch step.
Question: Why to split the processing in steps?
Answer: Management and error handling! Suppose a job of 1 million records in which only 100 failed. Dividing your process into steps makes it easier to retry each of those hundred records from the point they were left in. Suppose a job that has three steps. In the first one you do validation, in the second one you insert into Google Contacts and in the third one you insert into Salesforce contacts. If a record fails to be inserted into Google Contacts, you don’t want to retry it from the top since that would generate a duplicate into Google Contacts (or force you to check for existence first, which would make your job overly complex and affect performance). Dividing the job into steps allows us to retry that one record from that particular step.
Record Variables
Mule has the concept of message properties (flow variables, outbound and inbound properties, etc). Although available, these concepts don’t really fit into Batch because we’re not processing at a message level but at a record level. That’s why with batch processing we added the ability to set, remove and reference variables associated to individual records. Serialized and persisting only through the Process and On Complete phases (refer to image below), a record variable stores information at the record level, rather than the flow or session level. For example, you can use recordVars to capture whether or not a customer contact – as a record – already exists in a database.
You can set the record vars using a message processor (in the same fashion as message properties):
And yes, we also added MEL support for it so that you can access/set them through expression language:
Skipping Records
You can apply one or more filters as attributes to any number of batch steps within your batch job. Filtering out some records for processing by a batch step streamlines processing so that Mule focuses only on the data which is relevant for a particular batch step.
For example, you could apply a filter to the second batch step in your batch job to make sure that the second step doesn’t attempt to process any records which failed during processing in the first batch step. To put this in context of a use case, imagine a batch job which uses its first batch step to check to see if a Salesforce contact exists for a record; the second batch step updates each existing Salesforce contact with information newly added. In such a case, you could apply a filter to the second batch step to prevent it from processing records which failed during the first batch step, in other words, records for which a contact does not already exist.
Within a batch step – the only place where you can apply a batch filter – you have the option of using one of two methods for applying a filter.
Use a Accept Expression to process only those records which, relative to the MEL expression, evaluate to true; if the record evaluates to false, the batch step does not process the record. The example below filters out all records where the age is less than 21; the batch step does not process those records.
You can also use an Accept Policy to process only those records which, relative to the value of the accept policy attribute, evaluate to true. Refer to the table below for a list of the available values for accept policy. The example below illustrates the second batch step in a batch job which processes only those records which failed processing during the preceding step. In the first batch step, Mule checked each record to see if it had an existing Salesforce contact; the second batch step, which creates a contact for each record, processes only the failed records (i.e. failed to have an existing account).
There are 3 accept policies available:
NO_FAILURES (default): batch step processes only those records which succeeded
ALL: batch step processes all records, regardless of whether they failed processing in a preceding batch step
FAILURES_ONLY: batch step processes only those records which failed processing in a preceding batch steps
Fail Fast
So yes, sometimes a record can fail. But when they all start failing that probably means that something is wrong. It could be wrong data, network is down, etc. It’s very convenient in these kind of scenarios to be able to detect that situation and act upon it. If your batch has one million of bad data records, you take the risk of exceeding your API quota limit in vain. At the very least, you’re just wasting a lot of CPU time. That’s why batch jobs have the concept of maximum number of failed records allowed:
The above declaration means that the job instance will be stopped if more than 100 records are failed. If you set that value to zero (default) then no failure will be allowed and the event of any record failing will stop the job. Finally, you can set it to -1 to indicate that you’re willing to let the job instance finish no matter how many errors are found.
Batch Commit
You can use a Batch Commit block in a batch step to collect a subset of records within a job instance for bulk operations to an external service. For example, rather than upserting each individual contact (i.e. record) to Google Contacts, you can configure a Batch Commit to collect, let’s say 100 records, and upsert all of them to Google Contacts in one chunk.
Within a batch step – the only place you can apply it – you use a Batch Commit to wrap an outbound message processor. See the example below.
Demo Time
This example uses batch processing to address a use case in which the contents of a comma-separated value file (CSV) of leads – comprised of names, birthdays and email addresses – must be uploaded to Salesforce. To avoid duplicating any leads, the batch job checks to see if a lead exists before uploading data to Salesforce. The description below outlines the steps the batch job takes in each phase of processing.
INPUT PHASE
The application first uses a File Endpoint to upload a CSV file, then uses a DataMapper to convert the data format into a collection (see mapping below). Each item in the collection represents a lead. Each lead contains a company name, a first name, a last name, a birthday and an email address.
LOAD AND DISPATCH PHASE (IMPLICIT)
Invisible to the human eye, Mule creates a batch job instance, breaks the collection into records (each lead is now a record), queues the records for processing, then presents the ready-to-process batch job instance to the first batch step. None of these actions is configurable, thus Mule doesn’t expose any of these activities in the application.
PROCESS PHASE
Mule begins processing each lead as a record. The first batch step, lead-check, uses a SalesforceConnector wrapped with a Message Enricher to:
query Salesforce to find out if a lead already exists: because the message is now the record, the application uses a MEL expression to extract the email address from the payload, then uses it to query Salesforce to find out if the lead exists
enrich the message with a record variable to indicate that the record (i.e. lead) already exists in the Salesforce account
The second batch step, insert-lead, first filters out all the records for which leads already exist. It does so using an Accept Expression attribute on the batch step, indicating that any record that has been enriched with the record variable ‘exists‘ should be excluded for processing by this batch step.
Next, the batch step uses a Logger to simply log all the records which Mule enriched with an 'exists' record variable. The list this logger produces could be useful in auditing the application to find out which of the leads on the CSV file already exist in Salesforce.
Lastly, the batch step uses a SalesforceConnector wrapped with a Batch Commit to insert all new leads to Salesforce. The batch commit behaves a bit like an aggregator, collecting records as they trickle through the queue into the batch commit “bucket”. When it has collected 200 – as specified with the size attribute of the batch commit element – batch commit inserts all 200 records at once into Salesforce as new leads.
The final batch step, log-failures, uses a Logger to log all records which failed to insert to Salesforce.
ON COMPLETE PHASE
The application uses yet another Logger to create a simple summary (see console output below) which indicates:
the number of records which successfully loaded to Salesforce
the number of records which failed to load
Roadmap
December 2013 is merely the first release of the batch module. Many more awesome features are coming down the line such as:
Management console in CloudHub and MMC. Never again build your own UI to manage these jobs!
Infinite size commit blocks
Multinode support for reliable execution in a cluster
Support for persisting non-serializable objects
Many more cool things (but would have to kill you if I told you)
Take Aways
Ok, that was probably too much to take in into a single read, but hopefully it's a good introduction to the feature. Not only as a Mule developer but mainly as a former Mule user who suffered the absence of this feature I'm convinced that after you try a couple of examples you'll find it amazingly easy to handle large datasets/data integration scenarios.
APIs are causing a huge technology disruption. Developers armed with APIs are changing the enterprise IT landscape. The tech world is being turned upside down as developer API access is changing banking platforms, airline systems, e-commerce platforms and much more.
He discusses the importance of micro-features and how they fuel disruptive applications, as well as how companies with API strategies will be the ones to succeed. But how exactly do you arm yourself? By opening up existing platforms and API-enabling them, companies can start putting API strategies in place.
In this installment of our MuleSoft webinar series, we discuss how to identify legacy assets within your organization, synchronize data between modern and legacy systems, and service-enable legacy applications with APIs built through MuleESB.
Effectively implementing a Service Oriented Architecture approach within your enterprise can help deliver faster time to ROI through increased agility.
Today, a large amount of business data and processes are tied up in legacy systems, which are difficult to access and modify due to a lack of modern interfaces and a scarcity of available expertise to work on the system. Legacy systems house critical information and functionality that need to be accessed by other systems and people.
With demos and detailed discussions, you’ll learn to:
Hot on the heels of the announcement of the RESTful API Modeling Language (RAML) by the RAML working group, I am very happy to announce the general availability of APIkit.
APIkit consists of a set of open source Maven and Mule Studio-based tools that enable developers to be massively productive in creating well-designed REST APIs. APIkit features include the ability to take a REST API designed in RAML, automatically generate backend implementation flows for it, and then run and test the API with a pre-packaged console.
APIkit APIs are defined in RAML and are therefore RESTfull. To design a RAMLAPI, you can take advantage of the RAML API Designer. This web based tool allows anyone with minimal knowledge of RAML to design REST APIs, it continuously presents you with the allowed syntax at any given point within the definition of the API. The tool also dynamically maintains an interactive console, reflecting the structure of the API. This console enables API designers to get instant feedback from potential consumers of the API through a web based UI. The following is a screenshot of the RAMLAPI Designer.
As Uri Sarid (CTO at MuleSoft) explained in the previous post, the RAMLAPI Designer is MuleSoft’s open source contribution to RAML. In the spirit of spreading the creation of delightful APIs, we host the RAML designer on APIhub for anyone to access.
With the RAMLAPI Designer you can create a an API that delights your API consumers, but how will you implement the backend of the API? You could leverage any of your favorite programming languages or REST frameworks to ensure line-by-line compliance. But wouldn’t it be nice if you could just feed your RAML interface definition into a tool which would generate the stub implementation of your API automatically? Enter APIkit.
Once you have designed your RAML interface, you can feed it into APIkit, using either our Mule Studio tooling or Maven – from here on in this blog post we will focus on the Studio tooling.
In Studio, you can start with the RAML file either using the new project creation wizard, or by adding RAML files to an existing project. Mocked implementation flows for your RAML files are auto-generated if you specify the file as part of the project creation wizard. If you did not, you can always use the ‘Generate Flows’ feature on any given RAML file or the entire project as shown below.
The mocking behaviour of the backend flows is simple:
If the the RAML-defined description of a resource-action pairing includes an example payload, any test calls to the flow return a response with the example as the payload and an HTTP-status code of 200 – OK.
If the RAML-defined description of a resource-action pairing does not include an example payload, any test calls to the flow simply return a response with an empty payload and an HTTP-status code of 200 – OK.
Routing of requests to Mule flows are performed by a new Mule component called ‘APIkit Router’. By default, the routing is done implicitly through naming: Flows named with a specific syntax that include the target resource and method name are used for routing associated HTTP requests. For example, GET: /patient calls automatically route to the flow named get: /patient:apikit-config.
However, you can override this routing if you would like to use a different flow naming scheme or if you would like to leverage existing flows that you might already have implemented. Below is a screenshot of the configuration wizard for the APIkit Router.
At any time, you can run your APIkit project to interact with its APIs using the built-in interactive console. To do this, just run the application as you would in any project and then browse to its console path (which you would have configured as part of the APIkit router component). Here is for example the console for the example football league project that is included in APIkit and available as a Studio example template.
As the attendees of our MuleSoft Summits can attest, we released APIkit as a private beta program early this year, introducing it then as part of our Spring MuleSoft Summit series. This GA version – APIkit 1.0 – is largely the result of the valuable feedback we have been receiving from our beta users. We have very exciting plans to add ever more value and functionality to APIkit such as improving the console’s UI, and updating the toolkit to ensure compliance with the latest version of RAML. Looking towards a broader horizon, we aim to add support for SOAP-based APIs in the future.
In the meantime, we encourage you to get your hands on APIkit! We’re certain it will prove an invaluable tool in increasing developer productivity for the design and development of APIs in your organization. Get started with APIkit, then test drive it with our APIkit tutorial. After just one taste, you’ll never design RESTful APIs any other way.
CloudHub Release 34 is now live! With this release we’ve made a number of improvements to CloudHub to make managing your integrations easier. These include the ability to promote applications from sandboxes, monitor workers for problems, create secure environment variables, and scale applications vertically, as well as horizontally.
Back in the old days when I used to write SaaS integration apps for living (long time ago, like 2 months back…) I always found it somehow difficult to reconcile large datasets with the Anypoint Cloud Connectors. Don’t get me wrong, I love those connectors! They solve a lot of issues for me, from actually dealing with the API to handle security and reconnection. However, there’re use cases in which you want to retrieve large amounts of data from a Cloud Connectors (let’s say retrieve my 600K Salesforce contacts and put them in a CSV file). You just can’t pass that amount of information in one single API call, not to even mention that you’ll most likely won’t even be able to hold all of those contacts in memory. All of these puts you in a situation in which you will need to get the information in pages.
So, is this doable with Anypoint Connectors? Totally. But your experience around that would be a little clouded because:
Each connector handles paging its own way (the API’s way)
It requires the user to know and understand the underlying API’s paging mechanism
Because Mule semantics follow the Enterprise Integration Patterns, there’s no easy way to write a block like “do this while more pages are available”
Solving the problem
So we sat down to discuss this problem and came to the conclusion that we needed to achieve:
Usage Consistency: I don’t care how the API does pagination. I want to paginate always the same way, no matter the connector
Seamless Integration: I want to use DataMapper, ForEach, Aggregator, Collection Splitter, etc. without regards of the connector’s pagination
Automation: I want the pagination to happen behind the scenes… Streaming FTW!
size(): I want to be able to know the total amount of results even if all pages haven’t been retrieved yet
Consider an application that takes your Salesforce Contacts and transform them to CSV. As we said earlier, this is easy if you have an amount of contacts that would fit into memory and into the limits of the underlying API (salesforce doesn’t return more than 1000 objects per query operation). However, since the SalesforceConnector now supports auto-paging, the flow looks as simple as this no matter how large the dataset:
Wait a minute? I don’t see the paging complexity in that flow! EXACTLY! The connector handled it for you! Let’s take a closer look at the query operation:
As you can see there’s a new section now called paging with a Fetch Size parameter. This means that the operation supports auto paging and that it will bring your information in pages of 1000 items. So, you make the Query and use DataMapper to transform it into a CSV. It doesn’t matter if you have 10 million Salesforce Contacts, the auto paged connector will pass them one by one to DataMapper so that it can transform it. Because the whole process is using streaming behind scenes, you don’t have to worry about how Salesforce’s pagination API looks like nor about running out of memory.
Now let’s take a look at this other app. This one uses the Box connector to get into a Box folder that has AN ENORMOUS amount of pictures. Suppose that it has all the pics I ever took from my daughter ever (I had to bought an external Hard Drive just for that). So I want to get a list of all those files and make a list of them, but this time instead of DataMapper we’ll use ForEach and and expression component, just because I feel like it. This time the app looks like this:
If you compare this flow to the one before you’ll notice that they’re as different as they can be:
However, the paging experience is exactly the same:
So in summary, although Box’s and Salesforce’s paging mechanisms are as different as they get, you can just use the connectors and write your flows without actually caring about the size of the data sets and the mechanics involved, while always maintaining the same development experience.
What’s that variable?
You probably noticed that in both examples there’s a variable processor just after the query processor. In case you’re wondering, that variable is completely useless. You don’t need to have it. Why is it in the example then? Just because I wanted to show you that you can get the total size of the dataset even if you still haven’t started to consume all the pages:
Where can I use it?
Next to Mule October 2013 release, new versions of these connectors were released now supporting auto paging:
Can you share use cases in which this feature would make your life easier? Please share with us so that we can keep improving. Any feedback is welcome!
Today I’m going to share some valuables lessons learned about developing highly concurrent software. These are real life lessons that come straight from the development of the Mule ESB. This is a story about deadlocks, context switches, CPU usage and profiling, focusing in how to diagnose this issues which is often the hardest part of the solution.
So the story begins a couple of weeks ago when I started working on a new feature for Mule 3.5.0. You’ll hear the details about it soon enough but basically it’s a new feature that aims to address integration use cases which requires processing huge amount of data. As you can imagine then, this feature has to deal with parallelization, process management, atomicity, consistency, distributed locks, etc…. All the fun stuff!
Initial symptoms
So after 2 iterations of development I had my first alpha version which I proudly handed over my friendly QA co-worker (Luciano Gandini you’re the man!). He coded a couple of sample apps and started testing. Of course he came back with a list full of bugs, but one of them was about a performance bottleneck that in some cases turned into a deadlock. The issue also had this image attached:
Diagnose
Solving these kind of problems is pretty much like being a veterinarian. Your patient cannot tell you where it hurts or how it feels. All I had at the moment was a worried farmer saying “my Mule is walking slowly and doesn’t have much appetite”, which makes images like the one above extremely valuable… That is of course, as long as we’re able to interpret it. That’s the hard part!
So, what’s does the image above tell us? The image is a screenshot from a software called VisualVM, which is a profiling application that monitors a JVM instance and gives you useful insights about memory, CPU usage, and the active threads and their state. Here we can see:
The threads that are showing belong to a thread pool that my new feature creates. The tool showed a lot of other threads but for illustrative purposes I’m just showing these ones.
Next to each thread name there’s a timeline that shows each thread’s state through a period of time
When the thread is green, then it means it was processing.
When it’s yellow, it means that the wait() method was called on it and it’s waiting for a notify() or notifyAll() invokation to wake it up
Finally, red means that the thread is waiting to gain access over a monitor (which in simpler words means that it has reached a synchronized block or is waiting for some kind of lock)
So at this point we can already have our first conclusions:
All threads seem to be getting red at the same time, which much likely means that they’re all trying to access the same synchronized block at the same time. Also, they’re red most of the time which explains why work is being done slowly.
Also, there’re some threads that spend quite some time being yellow, aka waiting for something else to happen. Because there’re so many threads blocked, it’s hard to deduce why that’s happening at this point, so for now we’ll only focus on the red threads.
Allright! So now we know what’s happening which is a lot! However, we still don’t know why it’s happening… Meaning, we don’t know which pieces of code are causing this. That’s what a thread dump is useful for. Basically, a thread dump gives you the current stack trace for each of these threads at a given time so that you can see what they were actually doing. The dump showed this:
waiting to lock <7e69a3f18> (a org.mule.module.batch.engine.RecordBuffer$BufferHolder)
at org.mule.module.batch.engine.RecordBuffer$BufferHolder.access$3(RecordBuffer.java:128)
at org.mule.module.batch.engine.RecordBuffer.add(RecordBuffer.java:88)
at org.mule.module.batch.BatchStepAggregate.add(BatchStepAggregate.java:101)
at org.mule.module.batch.DefaultBatchStep.onRecord(DefaultBatchStep.java:144)
at org.mule.module.batch.BatchRecordWork.run(BatchRecordWork.java:62)
at org.mule.work.WorkerContext.run(WorkerContext.java:294)
at java.util.concurrent.ThreadPoolExecutor$Worker.runTask(ThreadPoolExecutor.java:895)
at java.util.concurrent.ThreadPoolExecutor$Worker.run(ThreadPoolExecutor.java:921)
at java.lang.Thread.run(Thread.java:680)
So that’s it! Threads are getting locked at line 88 of the RecordBuffer class. Congratulations: You just found your tumor!
Treatment
Luckily, this tumor was operable so with a little refactoring I was able to avoid any contention and remove the deadlock. But as you know, no surgical procedure is without an aftermatch, so before declaring the bug as fixed I did the test again and ran a profiling of my own. This time I used another profiler called Yourkit instead of VisualVM, mainly to take advantage of its usability features.
NOTE: I chose YourKit because I like its usability features and because Mulesoft has purchased licenses for it, so it came handy to do so. However, I do want to emphasise that other products such as JProfiler or Mission Control could have got the job done just as well. Just choose the one you like the most!
After repeating the test, I got this second image:
So red is mostly gone…. The ones you still see are because of network I/O and have reasonable length. However, what’s all the deal with all the yellow? Now most of my threads went from being blocked to being waiting. That’s not cool either! Deadlock are gone so the app would not hang anymore but performance hasn’t gone up, it’s just as slow as it was before. Additionally at this point I noticed a new symptom I hadn’t seen before: CPU usage was really low. Like under 20% percent.
What do we do now? The same as before, getting a thread dump on the waiting threads. The results were more surprising! Remember that I told you that these threads were part of a thread pool that my new feature creates? Well, it turns out that the threads were actually idle, just sitting there waiting for more work to come. I went through the code many times asking myself “how in hell is this possible?”… The answer was quite simple: while fighting the high complexity of the code, I lost sight of the simplicity of the configuration…
In short, I have a thread pool to do processing. We’ll call the threads in that pool “worker threads”. Plus, there’s another thread which has the responsibility of dispatching work to that pool (we’ll call it dispatcher thread). The dispatcher thread was able to generate work way faster than the worker threads were able to finish it. As a result, the pool gets exhausted pretty quickly. Thread pools often have configurable strategies to deal with exhaustion… Some strategies reject the excess of work, some wait… Turns out that the default configuration of the thread pool I was using was to execute the job in the invoking thread. That means, that the dispatcher thread could not keep dispatching work because it was busy processing the work that it was supposed to give to others. So, by the time the worker threads were ready to take more work in, they had to wait for the dispatcher thread to be available again.
As simple as this bug is, actually seeing it can be quite tricky. How did I discover this? By looking at the thread dump for the dispatcher thread. Once again, profilers are your friend.
Solution was easy: I just configured the thread pool to wait in case of exhaustion. In that way, as soon as a worker thread becomes available, the dispatcher thread wakes up and gives work to it. The profiler now looked like this:
Now we see that the worker threads are making efficient use of the CPU and there’re no red dots other than the inevitable I/O. CPU usage was now around 100% per cent and the app was 58% faster.
Less concurrency is more
One last thing: When I was checking CPU usage I noticed that although usage was around 100%, more than half was being used in “system operations” and only around 45% was actually being used by mule. This happened because the thread pool was way bigger than necessary. Parallelism is good, but you can never lose sight of the fact that the more threads you have, more overhead in context switches you’ll suffer. So, I took my thread pool down from 100 threads to only 16. The result? My test was now one minute faster. So remember: when you’re tuning for maximum CPU usage, don’t go for as many threads as you can allocate. Instead, search for the number that will give you maximum CPU usage with the lower context switch overhead.
Summary take-aways
I hope you find this useful. This is how we make our Mule gallop!
The key things you should remember from this post are:
When testing performance, use a profiler to make sure you’re making efficient use of your resources
Try to keep synchronized blocks to a minimum
Try to reduce wait times
Do not abuse your ability to start threads. Reduce the context switch overhead
But most importantly: It doesn’t matter how much data you have if you’re not able to interpret it and turn it into information
We’ve been using AngularJS at MuleSoft for building our upcoming web-based developer tools and so far we have really enjoyed using it. One area that’s really important to us as developers is unit testing our JavaScript code.This ensures we deliver high quality code that is easy to maintain and refactor and allows us to ship features quickly with confidence
Decorators in Angular are really useful for unit testing your Angular JavaScript code. This post is an example of how you can use them to to use them to create great unit tests.
First, we will start by defining two factories, one called greeter and the other called worldGreeter. What we want to achieve here is writing unit tests for the worldGreeter factory instance.
Let’s start with a module named myApp that contains both factories:
As you can see, worldGreeter is simply concatenating the input from greeter. So, when injecting worldGreeter the result will be the string HelloWorld.
Testing 1,2,3
The testing frameworks we will be using are mocha as runner and chai for assertions. So let’s write the test:
We will replace greeter with our own implementation. The additional injected parameter named $delegate is a reference to the old greeter instance. It is really helpful if you plan to use them with a mocking or stubbing framework like sinon.
Next, we are going to use another angular trick. We name the instance to be injected _worldGreetereter_ so we can have a worldGreeter instance on the describe scope. inject recognizes this and injects the proper instance allowing the usage of the more handy worldGreeter variable.
Finally, we write an assertion to verify that greeter was replaced successfully:
The bottom line
To sum up, great things can be achieved by using decorator in tests as it is really useful when having to replace instance dependencies. Last but not least, you can see the code working in this jsfiddle.
You have been redirected
You have been redirected to this page because Servicetrace has been acquired by MuleSoft. Click here to learn more.


