
It’s important to monitor your service and check if it is available and/or is performing as expected. To do this, we need to understand what service health means. In this article, I will present two different definitions. However, keep in mind that your project can have its own specific definition as well.
All examples are prepared in Mule runtime 4.2. If you are familiar with Spring Boot Actuator you should see some interface similarities. I have decided to use the Spring approach as it is clear and easy to read.
Service’s health
In order to efficiently monitor your services, a set of service’s health conditions should be chosen. It may be a universal list, but it may be tailored to your project’s specifications. Here are a couple of ideas that you can use:
- Has service started?
- Has a service reachable endpoint?
- Has runtime created anchor file?
- Has service successfully established a connection with another system via HTTP or any other protocol?
- Has service established a connection within threshold with another system?
This is just the beginning and it can be extended as needed. Keep in mind that health checks should be quick and simple and not too complex as it may lead to difficulty maintenance. I decided to present two approaches. The first one will be entirely focused on the question of whether my service has started. The second one will be more sophisticated, as I would expect to see if my service has established a connection within an acceptable threshold.
Anchor file
Health check condition: has our service been deployed?
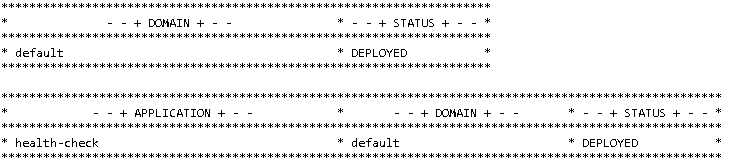
We have a couple of ways to check if the service is running in Mule runtime. First of all, we may look at mule-ee.log. After Mule service starts, in the log file, you should see the table with application start-up statuses. As in the screenshot below. We can tell that health-check application from the default domain has been DEPLOYED. Mule will set it to FAILED in case of any error.
Mule runtime creates file [application name]-anchor.txt when the service is deployed correctly. Note that extension txt will exist for both Windows and Linux systems. In this scenario, we need to look for file existence within the apps directory. Using the previous example, I would look for health-check-anchor.txt. If my monitoring tool will not find this file I should receive an alert that something went wrong.
Endpoint’s health
Spring Boot Actuator
While I was implementing microservices using Spring Boot, I have encounter Spring Boot Actuator library. This library enabled a couple of simple endpoints. The most important for me was /health and /info. The first one, shown below, allowed me easily to check my application’s status. As you can see although configService and hystrix are marked as UP overall status is DOWN. This means that some other conditions did not evaluate correctly.

Simple health check
Health check condition: Has our service been deployed? Does the service run?
How can we achieve that scenario? Mule does not have something like health endpoint allowing to check whether service is running or not. I think, that the easiest way would be to enable HTTP listener on specific URL like /health. Under this address, we should receive a clear status’ information. Like in the diagram below this can be as simple as always returning status UP by service with 200 HTTP status code.
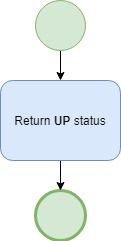
If I am not able to reach /health endpoint I know, promptly, that something is wrong with my service. On the other hand, if I receive any response I am happy to mark my service as running and working as expected. Let’s see something more complex.
Complex health check
Health check condition: Has our service been deployed? Does the service run? Has service established a connection with the external system withing a defined timeout threshold?
In comparison with the previous simple health check, here we have higher expectations towards our service. We expect that service can connect with an external system through HTTP protocol, or query DB using a simple select statement. What is more, we may require some timeout threshold to be met. The diagram below depicts a simple process.
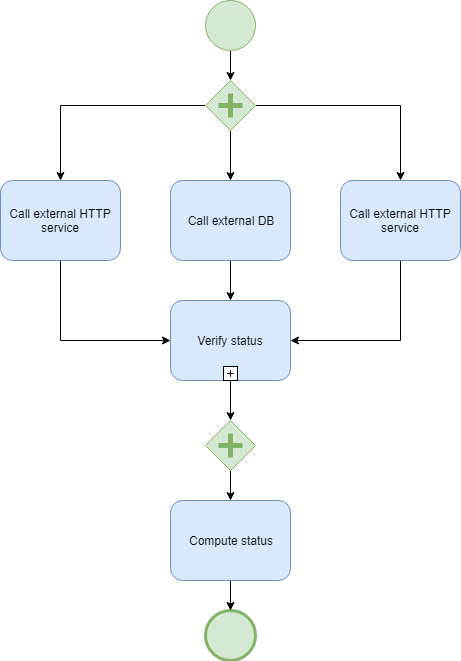
In the presented example, we are performing in parallel three different checks. Two external HTTP calls and one DB call. For each call, we perform custom status verification. For HTTP call it could be check if 200 or 201 HTTP status code has been returned. After all, steps have been performed, we compute overall service status. Usually, if one of call is marked as DOWN service status is also reflected as DOWN. The most complex part here is “Verify status” and “Compute status.” In these two actions, you can put as much custom login as you need.
HTTP status code
If you decide to expose the service’s status using rest endpoint you should also consider changing returned HTTP status. It is a good practice to return 200 code for a status UP and 503 in case of status DOWN. Why? 200 is fine, while DOWN status is definitely not fine. Most of all client code will notice that 5xx code occurred and this is an exceptional situation that requires some action.
Implementation
After this brief introduction to the service’s health status, it is time to see implementation in Mule runtime. I have prepared one application that has /health endpoint exposed. This endpoint only accents GET requests and return content in JSON.
Simple scenario
The first and easiest is to always return UP status. As you can see, we perform this in three steps. We could do it in only one step, however, I decided to have more generic flow. In consequence, only first message processor will change. More about this in the next section.
What this flow actually does is to set the status to successful. After calling GET /health we should always receive:
{ "status": "UP" } |
This solution is fairly simple, but it may fill your needs. If you have more sophisticated requirements, like checking for a connection or we get a response within specified time boundaries go to the next section.
Verifying connection
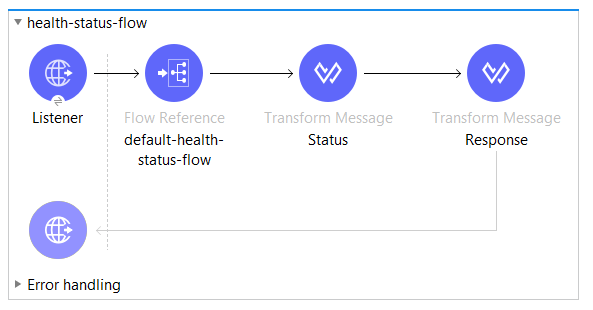
Flow health-status-flow is far more complex. First of all, we get a scatter-gather that calls two private flows concurrently. The next two steps, are similar to what you already saw. That is computing status and preparing a final response.
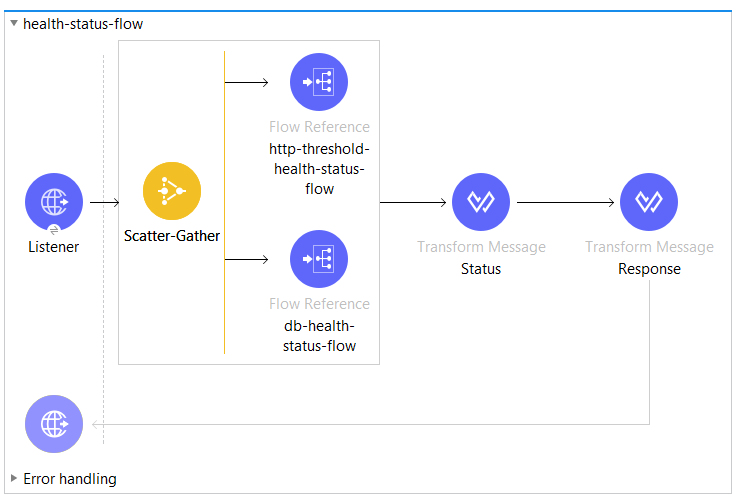
I am expecting structure like in the example below:
{"status":"DOWN","details":[{"serviceType":"http","status":"DOWN","errorCode":"THRESHOLD BREACHED","statusCode":200},{"serviceType":"db","status":"DOWN","errorCode":"CONNECTIVIT"}]}
In comparison to the previous example, now I have details arrays. Each item is a specific health check. For this particular example:
- getting response took longer than expected.
- connection to database did not work due to connectivity issues.
As a result, the overall status is DOWN.
Connecting to the HTTP endpoint
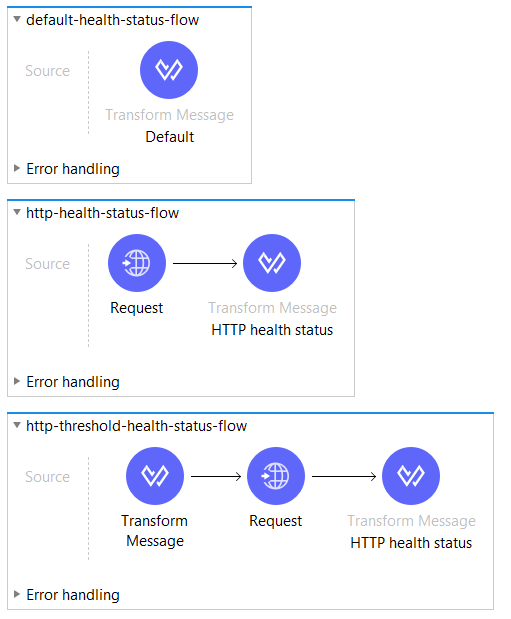
The flow that checks health, is performing request the compute status. Logic is fairly simple. If the HTTP response status code is 200, then the service’s status is UP. Mule runtime by default would throw an exception for codes greater or equal than 400. We need to suppress this behavior. In order to treat any status code as a success, we need to configure HTTP Request’ response validator like below:
<http:response-validator >
  <http:success-status-code-validator values="100...599" />
</http:response-validator>
Why I have decided on range from 100 to 599? Because this is a standard and I should not receive anything outside this range.
If you are not up to date with the newest match and if DataWeave syntax, you may find useful reading article DataWeave – Tip #1. To keep it short following transformation set variable status. DataWeave engine adds errorCode and statusCode properties when status equals “DOWN.”
%dw 2.0
output application/java
---
{
    serviceHealth: {
        serviceType: "http",
        (using (status = if (vars.service.statusCode == 200) "UP" else "DOWN") {
            status: status,
            (status match {
                case "DOWN" -> {
                    errorCode: vars.service.reasonPhrase,
                    statusCode: vars.service.statusCode
                }
                else -> {}
            })

        })
    }
}
Timeout threshold
We may also extend conditions and expect to receive a response within a specified time range. Both conditions should be fulfilled to consider status as running:
- HTTP response status code is 200.
- Connection time, less then defined threshold (if the threshold is specified).
In the case of a breached threshold, I would like to provide an error code. Here is the excerpt from transformation:
... errorCode: vars.service.reasonPhrase match { case met if thresholdMet -> $ else -> "THRESHOLD BREACHED"}, ...
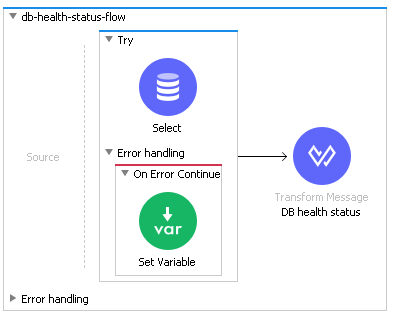
Connecting to DB
How can we check Database health? In Mule runtime we need to use Try block to handle all exceptions that can occur during the call to the database. We can use On Error Continue to continue our flow. Then in Transform Message, we check whether we received an error during the call and set status appropriately.
Source Code
Source Code is available at my GitHub account here. If you have any comments or questions regarding the code don’t hesitate to write to me.
Summary
To check if Mule runtime service has been deployed correctly we can use anchor files. In advanced scenarios where conditions are much more complex, it is worth to expose /health endpoint that would inform about the service’s status. We can define a threshold, we can perform simple calls to DB, etc. It is totally up to you and your requirements. Bear in mind that checks should not be too complex as it may become too cumbersome.


